
Northeast Community Bancorp (NECB): Price and Financial Metrics
NECB Price/Volume Stats
| Current price | $23.03 | 52-week high | $23.16 |
| Prev. close | $22.82 | 52-week low | $13.93 |
| Day low | $22.58 | Volume | 51,230 |
| Day high | $23.16 | Avg. volume | 45,723 |
| 50-day MA | $18.16 | Dividend yield | 1.78% |
| 200-day MA | $16.68 | Market Cap | 323.18M |
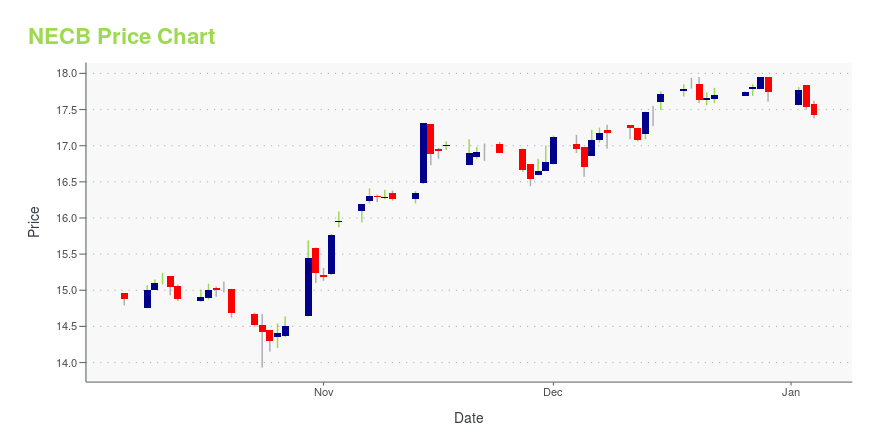
NECB Stock Price Chart Interactive Chart >
Northeast Community Bancorp (NECB) Company Bio
Northeast Community Bancorp, Inc. operates as the holding company for NorthEast Community Bank that provides financial services for individuals and businesses. It accepts various deposit instruments, including checking accounts, money market accounts, regular savings accounts, and non-interest bearing demand accounts. The company also offers construction, commercial and industrial, multifamily and mixed-use real estate, non-residential real estate loans, and consumer loans. In addition, it invests in various types of liquid assets, including U.S. Treasury obligations, municipal securities, deposits at the Federal Home Loan Bank of New York, and certificates of deposit of federally insured institutions, as well as securities of various federal agencies, and of state and municipal governments. Further, the company offers investment advisory and financial planning services; and life insurance products and fixed-rate annuities. It operates six full-service branches in New York and three full-service branches in Massachusetts; and loan production offices in White Plains and New City, New York. The company was founded in 1934 and is based in White Plains, New York.
Latest NECB News From Around the Web
Below are the latest news stories about NORTHEAST COMMUNITY BANCORP INC that investors may wish to consider to help them evaluate NECB as an investment opportunity.
Is It Smart To Buy Northeast Community Bancorp, Inc. (NASDAQ:NECB) Before It Goes Ex-Dividend?It looks like Northeast Community Bancorp, Inc. ( NASDAQ:NECB ) is about to go ex-dividend in the next four days. The... |
NorthEast Community Bancorp, Inc. Announces Quarterly Cash DividendWHITE PLAINS, N.Y., Dec. 21, 2023 (GLOBE NEWSWIRE) -- NorthEast Community Bancorp, Inc. (the “Company”) (Nasdaq: NECB) announced today that its Board of Directors has declared a quarterly cash dividend of $0.06 per common share. The dividend will be paid on or about February 5, 2024 to shareholders of record as of the close of business on January 3, 2024. About NorthEast Community Bancorp, Inc. The Company is the holding company for NorthEast Community Bank. NorthEast Community Bank is a New Yor |
Northeast Community Bancorp, Inc. (NASDAQ:NECB) is largely controlled by institutional shareholders who own 53% of the companyKey Insights Significantly high institutional ownership implies Northeast Community Bancorp's stock price is sensitive... |
4 Best Breakout Stocks to Invest in for Solid ReturnsDenison Mine Corp (DNN), TIM (TIMB), ReNew Energy Global (RNW) and Northeast Community Bancorp (NECB) have been selected as the breakout stocks for today. |
Best Momentum Stock to Buy for November 7thNECB, STRA and CB made it to the Zacks Rank #1 (Strong Buy) momentum stocks list on November 7, 2023. |
NECB Price Returns
| 1-mo | 33.09% |
| 3-mo | 45.83% |
| 6-mo | 31.84% |
| 1-year | 44.24% |
| 3-year | 143.93% |
| 5-year | N/A |
| YTD | 31.84% |
| 2023 | 20.41% |
| 2022 | 38.91% |
| 2021 | -17.85% |
| 2020 | 16.28% |
| 2019 | 9.72% |
NECB Dividends
| Ex-Dividend Date | Type | Payout Amount | Change | ||||||
|---|---|---|---|---|---|---|---|---|---|
| Loading, please wait... | |||||||||
Loading social stream, please wait...