NeoGenomics, Inc. (NEO): Price and Financial Metrics

NeoGenomics, Inc. (NEO): $17.03

0.01 (+0.06%)

POWR Rating

Component Grades

Momentum

D

Stability

C

Sentiment

Quality

C

Add NEO to Watchlist
Sign Up

NEO Price/Volume Stats
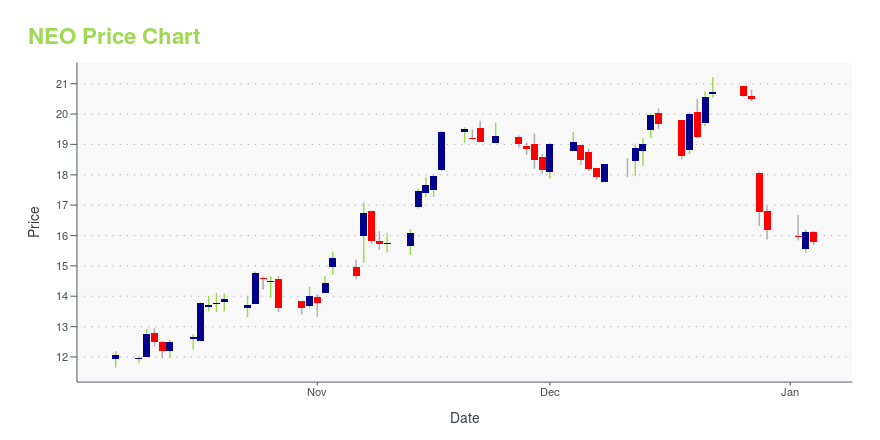
Current price $17.03 52-week high $20.54
Prev. close $17.02 52-week low $6.00
Day low $16.75 Volume 487,992
Day high $17.28 Avg. volume 1,092,962
50-day MA $16.59 Dividend yield N/A
200-day MA $12.44 Market Cap 2.17B

NEO Stock Price Chart Interactive Chart >

NEO POWR Grades

  • Growth is the dimension where NEO ranks best; there it ranks ahead of 92.08% of US stocks.
  • NEO's strongest trending metric is Growth; it's been moving up over the last 179 days.
  • NEO ranks lowest in Momentum; there it ranks in the 4th percentile.

NEO Stock Summary

  • With a price/sales ratio of 4.31, NEOGENOMICS INC has a higher such ratio than 75.76% of stocks in our set.
  • In terms of twelve month growth in earnings before interest and taxes, NEOGENOMICS INC is reporting a growth rate of 236.96%; that's higher than 93.89% of US stocks.
  • The volatility of NEOGENOMICS INC's share price is greater than that of 83.82% US stocks with at least 200 days of trading history.
  • If you're looking for stocks that are quantitatively similar to NEOGENOMICS INC, a group of peers worth examining would be TMCI, EVER, WTT, DGLY, and RKDA.
  • Visit NEO's SEC page to see the company's official filings. To visit the company's web site, go to www.neogenomics.com.

NEO Valuation Summary

  • In comparison to the median Healthcare stock, NEO's EV/EBIT ratio is 255% lower, now standing at -18.6.
  • NEO's EV/EBIT ratio has moved down 2.6 over the prior 234 months.

Below are key valuation metrics over time for NEO.

Stock Date P/S P/B P/E EV/EBIT
NEO 2023-05-23 4.3 2.3 -18.2 -18.6
NEO 2023-05-22 4.4 2.4 -18.6 -18.9
NEO 2023-05-19 4.3 2.3 -18.2 -18.5
NEO 2023-05-18 4.3 2.4 -18.3 -18.7
NEO 2023-05-17 4.4 2.4 -18.6 -18.9
NEO 2023-05-16 4.3 2.3 -18.2 -18.5

NEO Growth Metrics

    Its 4 year net income to common stockholders growth rate is now at 112.24%.
  • Its 4 year net cashflow from operations growth rate is now at -18.8%.
  • Its 2 year net cashflow from operations growth rate is now at -660.72%.
Over the past 52 months, NEO's revenue has gone up $241,670,000.

The table below shows NEO's growth in key financial areas (numbers in millions of US dollars).

Date Revenue Operating Cash Flow Net Income to Common Stock
2022-12-31 509.728 -65.993 -144.25
2022-09-30 496.755 -82.084 -163.322
2022-06-30 489.313 -73.579 -146.818
2022-03-31 485.965 -57.973 -35.642
2021-12-31 484.329 -26.723 -8.347
2021-09-30 484.594 -0.962 48.828

NEO's Quality Factors

The “Quality” component of the POWR Ratings focuses on 31 different factors of a companies fundamentals and operational strength. Here are some key insights as we drill into the specifics of these quality attributes.
  • NEO has a Quality Grade of C, ranking ahead of 30.23% of graded US stocks.
  • NEO's asset turnover comes in at 0.366 -- ranking 397th of 561 Business Services stocks.
  • MSFT, VRNS, and SGRP are the stocks whose asset turnover ratios are most correlated with NEO.

The table below shows NEO's key quality metrics over time.

Period Asset Turnover Gross Margin ROIC
2021-06-30 0.366 0.422 0.085
2021-03-31 0.414 0.399 -0.033
2020-12-31 0.490 0.418 -0.014
2020-09-30 0.508 0.419 -0.033
2020-06-30 0.522 0.433 -0.042
2020-03-31 0.589 0.468 0.016

NEO Price Target

For more insight on analysts targets of NEO, see our NEO price target page. And for a list of of all stocks sorted by upside potential based on analyst target price, see our Top Price Target page.

Average Price Target $56.80 Average Broker Recommendation 1.25 (Strong Buy)

NeoGenomics, Inc. (NEO) Company Bio


NeoGenomics, Inc. operates a network of cancer-focused testing laboratories providing genetic and molecular testing services to hospitals, pathologists, oncologists, urologists, other clinicians and researchers, and other laboratories in the United States. The company was founded in 2001 and is based in Fort Myers, Florida.


NEO Latest News Stream


Event/Time News Detail
Loading, please wait...

NEO Latest Social Stream


Loading social stream, please wait...

View Full NEO Social Stream

Latest NEO News From Around the Web

Below are the latest news stories about NEOGENOMICS INC that investors may wish to consider to help them evaluate NEO as an investment opportunity.

Zacks.com featured highlights include First Watch Restaurant, NeoGenomics and Universal Stainless & Alloy Products

First Watch Restaurant, NeoGenomics and Universal Stainless & Alloy Products are part of the Zacks Screen of the Week article.

Yahoo | May 17, 2023

3 Best Breakout Stocks to Invest in for Superlative Returns

First Watch Restaurant Group (FWRG), NeoGenomics (NEO), and Universal Stainless & Alloy Products (USAP) have been selected as the breakout stocks for today.

Yahoo | May 16, 2023

4 big analyst picks: Alcon upgraded to Outperform after Q1 beat | Pro Recap

Baird upgraded Alcon (NYSE:ALC) to Outperform from Neutral and raised its price target to $90.00 from $75.00 following Q1 earnings. Shares jumped more than 7% pre-market today after the company reported its Q1 results, with EPS of $0.70 and revenue of $2.3 billion beating the consensus estimates. BTIG upgraded NeoGenomics (NASDAQ:NEO) to Buy from Neutral with a price target of $25.00, noting it was impressed by the change in underlying growth at the company since the new management team has taken over.

Yahoo | May 10, 2023

NeoGenomics Reports Q1 Topline Growth, Lifts Annual Guidance, Shares Soar

NeoGenomics Inc (NASDAQ: NEO) reported Q1 revenues of $137.22 million, +17.1% Y/Y beating the consensus of $126.39 million. Clinical Services revenue of $115 million increases 16% Y/Y. Clinical test volume increased by 7%. The average revenue per clinical test increased by 8% to $402. Pharma Services revenue increased by 22% to $22 million. Adjusted EBITDA loss was $(7) million compared to $(19) million in the first quarter of 2022. Adjusted Net Loss was $(12) million compared to $(25) million a

Yahoo | May 9, 2023

NeoGenomics (NEO) Reports Q1 Loss, Tops Revenue Estimates

NeoGenomics (NEO) delivered earnings and revenue surprises of 35.71% and 8.64%, respectively, for the quarter ended March 2023. Do the numbers hold clues to what lies ahead for the stock?

Yahoo | May 8, 2023

Read More 'NEO' Stories Here

NEO Price Returns

1-mo 15.69%
3-mo -1.79%
6-mo 46.56%
1-year 102.26%
3-year -36.19%
5-year 35.81%
YTD 84.31%
2022 -72.92%
2021 -36.63%
2020 84.07%
2019 131.96%
2018 42.33%

Continue Researching NEO

Here are a few links from around the web to help you further your research on Neogenomics Inc's stock as an investment opportunity:

Neogenomics Inc (NEO) Stock Price | Nasdaq
Neogenomics Inc (NEO) Stock Quote, History and News - Yahoo Finance
Neogenomics Inc (NEO) Stock Price and Basic Information | MarketWatch

Get Free Updates

Join thousands of investors who get the latest news, insights and top rated picks from StockNews.com!