Neogen Corporation (NEOG): Price and Financial Metrics
GET POWR RATINGS... FREE!
NEOG POWR Grades
- Value is the dimension where NEOG ranks best; there it ranks ahead of 37.35% of US stocks.
- NEOG's strongest trending metric is Quality; it's been moving down over the last 177 days.
- NEOG's current lowest rank is in the Sentiment metric (where it is better than 7.4% of US stocks).
NEOG Stock Summary
- NEOGEN CORP's capital turnover -- a measure of revenue relative to shareholder's equity -- is better than only 17.44% of US listed stocks.
- NEOG's one year PEG ratio, measuring expected growth in earnings next year relative to current common stock price is 329.39 -- higher than 91.08% of US-listed equities with positive expected earnings growth.
- NEOG's price/sales ratio is 6.24; that's higher than the P/S ratio of 83.07% of US stocks.
- Stocks that are quantitatively similar to NEOG, based on their financial statements, market capitalization, and price volatility, are CYRX, CIR, NTIC, ZUMZ, and CENT.
- Visit NEOG's SEC page to see the company's official filings. To visit the company's web site, go to www.neogen.com.
NEOG Valuation Summary
- In comparison to the median Healthcare stock, NEOG's price/sales ratio is 31.91% higher, now standing at 6.2.
- Over the past 243 months, NEOG's EV/EBIT ratio has gone up 242.4.
Below are key valuation metrics over time for NEOG.
Stock | Date | P/S | P/B | P/E | EV/EBIT |
---|---|---|---|---|---|
NEOG | 2023-03-24 | 6.2 | 1.3 | -242.5 | 255.0 |
NEOG | 2023-03-23 | 6.3 | 1.3 | -243.6 | 256.0 |
NEOG | 2023-03-22 | 6.3 | 1.3 | -244.4 | 256.7 |
NEOG | 2023-03-21 | 6.5 | 1.3 | -251.8 | 263.1 |
NEOG | 2023-03-20 | 6.2 | 1.3 | -241.5 | 254.1 |
NEOG | 2023-03-17 | 6.3 | 1.3 | -246.1 | 258.2 |
NEOG Growth Metrics
- Its 2 year cash and equivalents growth rate is now at -15.55%.
- Its year over year price growth rate is now at -29.08%.
- Its 2 year net cashflow from operations growth rate is now at -14.19%.

The table below shows NEOG's growth in key financial areas (numbers in millions of US dollars).
Date | Revenue | Operating Cash Flow | Net Income to Common Stock |
---|---|---|---|
2022-12-31 | 630.719 | -5.888 | -16.23 |
2022-09-30 | 531.203 | 30.685 | 36.439 |
2022-06-30 | 527.159 | 68.038 | 48.307 |
2022-03-31 | 514.491 | 69.617 | 49.108 |
2021-12-31 | 502.956 | 74.622 | 57.042 |
2021-09-30 | 487.439 | 79.165 | 62.099 |
NEOG's Quality Factors
The “Quality” component of the POWR Ratings focuses on 31 different factors of a companies fundamentals and operational strength. Here are some key insights as we drill into the specifics of these quality attributes.- NEOG has a Quality Grade of C, ranking ahead of 68.43% of graded US stocks.
- NEOG's asset turnover comes in at 0.545 -- ranking 74th of 680 Pharmaceutical Products stocks.
- UTHR, HSKA, and VNDA are the stocks whose asset turnover ratios are most correlated with NEOG.
The table below shows NEOG's key quality metrics over time.
Period | Asset Turnover | Gross Margin | ROIC |
---|---|---|---|
2021-08-31 | 0.545 | 0.461 | 0.140 |
2021-05-31 | 0.540 | 0.459 | 0.141 |
2021-02-28 | 0.538 | 0.465 | 0.147 |
2020-11-30 | 0.535 | 0.463 | 0.146 |
2020-08-31 | 0.542 | 0.466 | 0.148 |
2020-05-31 | 0.550 | 0.469 | 0.150 |
NEOG Price Target
For more insight on analysts targets of NEOG, see our NEOG price target page. And for a list of of all stocks sorted by upside potential based on analyst target price, see our Top Price Target page.
Average Price Target | $55.00 | Average Broker Recommendation | 2 (Hold) |
NEOG Stock Price Chart Interactive Chart >
NEOG Price/Volume Stats
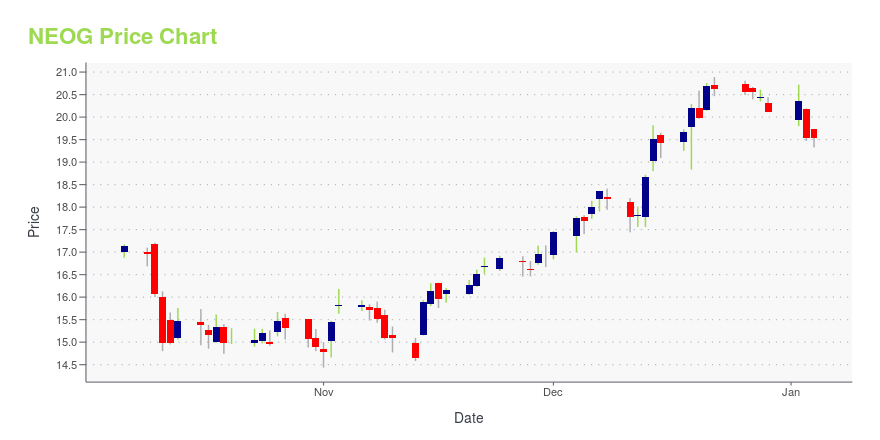
Current price | $18.26 | 52-week high | $32.65 |
Prev. close | $18.30 | 52-week low | $10.49 |
Day low | $18.01 | Volume | 965,528 |
Day high | $18.41 | Avg. volume | 2,041,292 |
50-day MA | $19.19 | Dividend yield | N/A |
200-day MA | $18.14 | Market Cap | 3.95B |
Neogen Corporation (NEOG) Company Bio
Neogen Corporation develops, manufactures, and markets various products and services for food and animal safety worldwide. It operates through two segments, Food Safety and Animal Safety. The company was founded in 1981 and is based in Lansing, Michigan.
Latest NEOG News From Around the Web
Below are the latest news stories about NEOGEN CORP that investors may wish to consider to help them evaluate NEOG as an investment opportunity.
These 2 Medical Stocks Could Beat Earnings: Why They Should Be on Your RadarWhy investors should use the Zacks Earnings ESP tool to help find stocks that are poised to top quarterly earnings estimates. |
Neogen (NEOG) Receives New Label Claims for Viroxide SuperNeogen's (NEOG) Viroxide Super active constituents are potassium peroxymonosulfate and sodium chloride, which have been verified effective against multiple industry-relevant bacteria and viruses. |
Neogen® Viroxide Super™ Receives New Label Claims in U.S. and CanadaNeogen Corporation (NASDAQ: NEOG) announced today that the U.S. Environmental Protection Agency (EPA) has approved additional virucide claims to its Neogen® Viroxide Super™ disinfectant. These label claims specify that Neogen Viroxide Super kills viruses* on hard non-porous surfaces that cause Avian Influenza A, Bovine Viral Diarrhea, Porcine Respiratory and Reproductive Syndrome (PRRS), and African Swine Fever. In Canada, Health Canada has also approved additional kill claims on non-porous surf |
Neogen (NEOG) Expected to Beat Earnings Estimates: What to Know Ahead of Q3 ReleaseNeogen (NEOG) possesses the right combination of the two key ingredients for a likely earnings beat in its upcoming report. Get prepared with the key expectations. |
Neogen Announces Third-Quarter Earnings Release DateNeogen Corporation (NASDAQ: NEOG) will issue its third-quarter earnings release before the opening of the market on Thursday, March 30, 2023. Executives from the company will host a webcast and conference call later that morning, beginning at 8:00 a.m. Eastern time, to discuss the financial results. |
NEOG Price Returns
1-mo | -1.88% |
3-mo | 24.05% |
6-mo | 25.41% |
1-year | -42.07% |
3-year | -37.67% |
5-year | -45.48% |
YTD | 19.89% |
2022 | -66.46% |
2021 | 14.53% |
2020 | 21.51% |
2019 | 14.49% |
2018 | -7.55% |
Continue Researching NEOG
Want to do more research on Neogen Corp's stock and its price? Try the links below:Neogen Corp (NEOG) Stock Price | Nasdaq
Neogen Corp (NEOG) Stock Quote, History and News - Yahoo Finance
Neogen Corp (NEOG) Stock Price and Basic Information | MarketWatch
Loading social stream, please wait...