
Neonode Inc. (NEON): Price and Financial Metrics
NEON Price/Volume Stats
| Current price | $3.01 | 52-week high | $4.28 |
| Prev. close | $3.00 | 52-week low | $1.02 |
| Day low | $2.93 | Volume | 34,200 |
| Day high | $3.08 | Avg. volume | 105,959 |
| 50-day MA | $2.47 | Dividend yield | N/A |
| 200-day MA | $1.84 | Market Cap | 46.23M |
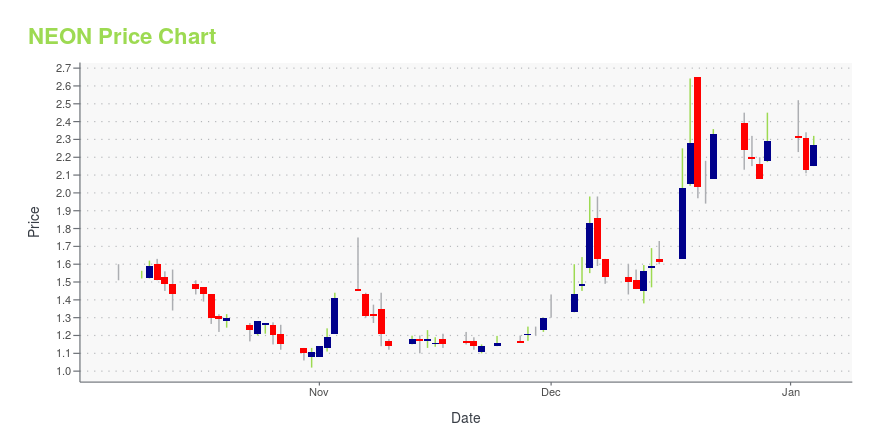
NEON Stock Price Chart Interactive Chart >
Neonode Inc. (NEON) Company Bio
Neonode Inc. develops and licenses user interfaces and optical multi-touch solutions for consumer brands. The Company is focused on licensing its technology to Original Equipment Manufacturers and ("OEMs") and Original Design Manufacturers ("ODMs") who embed their technology into electronic devices.
Latest NEON News From Around the Web
Below are the latest news stories about NEONODE INC that investors may wish to consider to help them evaluate NEON as an investment opportunity.
Neonode Launches Sharpened Strategy with Full Focus on Its Licensing BusinessNeonode Inc. (NASDAQ: NEON) today announces a new, sharpened strategy with full focus on its licensing business. Consequently, Neonode will phase out its Touch Sensor Module ("TSM") product business through licensing of the TSM technology to strategic partners or outsourcing. |
Neonode Awarded by Leading Commercial Vehicle OEM to Supply MultiSensing® Driver Monitoring System SoftwareNeonode Inc. (NASDAQ: NEON) has been awarded by a leading commercial vehicle OEM to supply Driver Monitoring System (DMS) software to the OEM's global range of commercial vehicles. Neonode will provide a bespoke solution based on its proprietary MultiSensing platform. Neonode will receive licensing revenues from 2025 when the first vehicles equipped with Neonode's solution reach the market. The program will also generate non-recurring engineering revenues for Neonode during the coming years. |
Neonode (NASDAQ:NEON) Is In A Good Position To Deliver On Growth PlansJust because a business does not make any money, does not mean that the stock will go down. For example, although... |
Neonode Inc. (NASDAQ:NEON) Q3 2023 Earnings Call TranscriptNeonode Inc. (NASDAQ:NEON) Q3 2023 Earnings Call Transcript November 9, 2023 Jesper Von Koch: Hi. And warm welcome to the Neonode Q3 2023 Earnings Call. So, we’ll start with a company presentation by the CEO and CFO of Neonode, followed by a Q&A session by the Company’s analyst. So with that said, I welcome Urban […] |
Neonode Inc (NEON) Reports Decline in Revenue and Widening Net Loss in Q3 2023Financial Performance Indicates Challenges Amidst Efforts to Stabilize Licensing Business |
NEON Price Returns
| 1-mo | 38.07% |
| 3-mo | 52.79% |
| 6-mo | 65.38% |
| 1-year | -24.94% |
| 3-year | -46.54% |
| 5-year | 7.50% |
| YTD | 31.44% |
| 2023 | -58.36% |
| 2022 | -37.85% |
| 2021 | 31.11% |
| 2020 | 247.94% |
| 2019 | 16.87% |
Continue Researching NEON
Here are a few links from around the web to help you further your research on Neonode Inc's stock as an investment opportunity:Neonode Inc (NEON) Stock Price | Nasdaq
Neonode Inc (NEON) Stock Quote, History and News - Yahoo Finance
Neonode Inc (NEON) Stock Price and Basic Information | MarketWatch
Loading social stream, please wait...