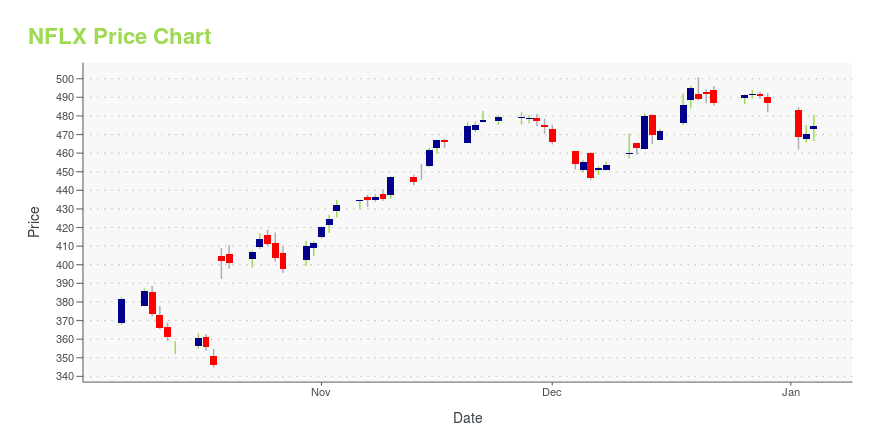
Netflix Inc. (NFLX): Price and Financial Metrics
GET POWR RATINGS... FREE!
NFLX POWR Grades
- NFLX scores best on the Quality dimension, with a Quality rank ahead of 78.94% of US stocks.
- NFLX's strongest trending metric is Quality; it's been moving up over the last 177 days.
- NFLX ranks lowest in Momentum; there it ranks in the 7th percentile.
NFLX Stock Summary
- With a market capitalization of $162,374,627,646, NETFLIX INC has a greater market value than 98.83% of US stocks.
- With a price/earnings ratio of 32.19, NETFLIX INC P/E ratio is greater than that of about 78.13% of stocks in our set with positive earnings.
- Price to trailing twelve month operating cash flow for NFLX is currently 137.71, higher than 97.27% of US stocks with positive operating cash flow.
- Stocks that are quantitatively similar to NFLX, based on their financial statements, market capitalization, and price volatility, are TXN, RTX, BA, AMGN, and BMY.
- NFLX's SEC filings can be seen here. And to visit NETFLIX INC's official web site, go to www.netflix.com.
NFLX Valuation Summary
- In comparison to the median Consumer Cyclical stock, NFLX's price/earnings ratio is 124.12% higher, now standing at 28.8.
- NFLX's EV/EBIT ratio has moved up 33.9 over the prior 243 months.
Below are key valuation metrics over time for NFLX.
Stock | Date | P/S | P/B | P/E | EV/EBIT |
---|---|---|---|---|---|
NFLX | 2023-01-17 | 4.6 | 7.1 | 28.8 | 23.5 |
NFLX | 2023-01-13 | 4.7 | 7.2 | 29.4 | 24.0 |
NFLX | 2023-01-12 | 4.7 | 7.2 | 29.1 | 23.8 |
NFLX | 2023-01-11 | 4.6 | 7.1 | 28.9 | 23.6 |
NFLX | 2023-01-10 | 4.6 | 7.1 | 28.9 | 23.6 |
NFLX | 2023-01-09 | 4.5 | 6.8 | 27.8 | 22.8 |
NFLX Growth Metrics
- The 5 year net income to common stockholders growth rate now stands at 561.82%.
- Its year over year cash and equivalents growth rate is now at -28.5%.
- Its 3 year net cashflow from operations growth rate is now at 119.06%.

The table below shows NFLX's growth in key financial areas (numbers in millions of US dollars).
Date | Revenue | Operating Cash Flow | Net Income to Common Stock |
---|---|---|---|
2022-09-30 | 31,472.81 | 1,179.125 | 5,044.069 |
2022-06-30 | 31,030.69 | 704.694 | 5,094.898 |
2022-03-31 | 30,402.33 | 538.183 | 5,006.96 |
2021-12-31 | 29,697.84 | 392.61 | 5,116.228 |
2021-09-30 | 28,632.97 | 658.212 | 5,050.955 |
2021-06-30 | 27,585.14 | 1,839.594 | 4,391.86 |
NFLX's Quality Factors
The “Quality” component of the POWR Ratings focuses on 31 different factors of a companies fundamentals and operational strength. Here are some key insights as we drill into the specifics of these quality attributes.- NFLX has a Quality Grade of B, ranking ahead of 79.64% of graded US stocks.
- NFLX's asset turnover comes in at 0.702 -- ranking 7th of 44 Entertainment stocks.
- AESE, WMG, and EVRI are the stocks whose asset turnover ratios are most correlated with NFLX.
The table below shows NFLX's key quality metrics over time.
Period | Asset Turnover | Gross Margin | ROIC |
---|---|---|---|
2021-09-30 | 0.702 | 0.432 | 0.479 |
2021-06-30 | 0.694 | 0.423 | 0.424 |
2021-03-31 | 0.680 | 0.411 | 0.388 |
2020-12-31 | 0.666 | 0.389 | 0.305 |
2020-09-30 | 0.658 | 0.388 | 0.287 |
2020-06-30 | 0.660 | 0.390 | 0.327 |
NFLX Price Target
For more insight on analysts targets of NFLX, see our NFLX price target page. And for a list of of all stocks sorted by upside potential based on analyst target price, see our Top Price Target page.
Average Price Target | $614.38 | Average Broker Recommendation | 1.57 (Moderate Buy) |
NFLX Stock Price Chart Interactive Chart >
NFLX Price/Volume Stats
Current price | $354.04 | 52-week high | $458.48 |
Prev. close | $353.11 | 52-week low | $162.71 |
Day low | $348.71 | Volume | 2,326,328 |
Day high | $355.95 | Avg. volume | 10,142,796 |
50-day MA | $312.73 | Dividend yield | N/A |
200-day MA | $245.26 | Market Cap | 157.67B |
Netflix Inc. (NFLX) Company Bio
Netflix Inc. is a global streaming entertainment service provider with over 200 million paid members in over 190 countries offering TV series, documentaries, and feature films across a wide variety of genres and languages. Netflix was originally established as an online DVD rental service in 1997, offering members unlimited DVD rentals without due dates, late fees, or monthly rental limits. Netflix has since shifted to an online streaming service where subscribers can watch as much commercial-free content as they want, anytime, anywhere, on any internet-connected screen for a fixed monthly subscription fee.
Latest NFLX News From Around the Web
Below are the latest news stories about NETFLIX INC that investors may wish to consider to help them evaluate NFLX as an investment opportunity.
What Binge-Worthy Shows And Movies Are Coming To Netflix In February?‘ Netflix and Chill’ — if this is your mantra to have a perfect date with your loved ones or a solo relaxing night, then you are at the right place. What Happened: Netflix Inc. (NASDAQ: NFLX ) is home to a plethora of great content. Whether you are a hard-core anime fan or love romantic comedies — the steaming platform has something for everyone. See Also: Breakups Won’t Hurt Your Netflix Experience Anymore With New Feature — But Freeloaders, Watch Out! As the first month of this year ends — let’s not discuss how quickly January vanished — here’s the list of upcoming binge-worthy TV shows and movies on the platform that will live in your mind rent-free. Avid binge-watchers, you can start the February rollercoaster ride with: 1) “Bill Russell: Legend” Release Date: Feb. 8 This documentar... |
Netflix Stock (NASDAQ:NFLX): Hastings’ Resignation Raises QuestionsNetflix (NASDAQ:NFLX) stock’s comeback has been quite explosive, with shares now up more than 115% off June lows. Reed Hastings‘ recent resignation… |
3 Tech Stocks That Will Be Big Winners in 2023Investing in tech stocks can be a great way to diversify your portfolio and gain exposure to some of the most exciting companies. |
Most Active Equity Options For Midday - Friday, Jan. 27Here are the most active equity options for midday. |
Most Active Equity Options For Midday - Wed., Jan. 26Here are the most active equity options for midday. |
NFLX Price Returns
1-mo | 20.06% |
3-mo | 29.68% |
6-mo | 53.99% |
1-year | -17.11% |
3-year | 2.59% |
5-year | 33.56% |
YTD | 20.06% |
2022 | -51.05% |
2021 | 11.41% |
2020 | 67.11% |
2019 | 20.89% |
2018 | 39.44% |
Continue Researching NFLX
Here are a few links from around the web to help you further your research on Netflix Inc's stock as an investment opportunity:Netflix Inc (NFLX) Stock Price | Nasdaq
Netflix Inc (NFLX) Stock Quote, History and News - Yahoo Finance
Netflix Inc (NFLX) Stock Price and Basic Information | MarketWatch
Loading social stream, please wait...