New Gold Inc. (NGD): Price and Financial Metrics
GET POWR RATINGS... FREE!
NGD POWR Grades
- Value is the dimension where NGD ranks best; there it ranks ahead of 87.37% of US stocks.
- NGD's strongest trending metric is Growth; it's been moving down over the last 177 days.
- NGD ranks lowest in Growth; there it ranks in the 5th percentile.
NGD Stock Summary
- Price to trailing twelve month operating cash flow for NGD is currently 2.99, higher than just 11.37% of US stocks with positive operating cash flow.
- Over the past twelve months, NGD has reported earnings growth of 187.22%, putting it ahead of 91.68% of US stocks in our set.
- Shareholder yield, a measure of how much is returned to shareholders via dividends and share repurchases, for NGD comes in at 13.99% -- higher than that of 89.11% of stocks in our set.
- If you're looking for stocks that are quantitatively similar to NEW GOLD INC, a group of peers worth examining would be MESO, KGC, OPGN, ALSN, and ST.
- NGD's SEC filings can be seen here. And to visit NEW GOLD INC's official web site, go to www.newgold.com.
NGD Valuation Summary
- NGD's price/sales ratio is 1.2; this is 40% lower than that of the median Basic Materials stock.
- NGD's price/sales ratio has moved down 714.6 over the prior 222 months.
Below are key valuation metrics over time for NGD.
Stock | Date | P/S | P/B | P/E | EV/EBIT |
---|---|---|---|---|---|
NGD | 2023-01-31 | 1.2 | 0.8 | 8.0 | 7.5 |
NGD | 2023-01-30 | 1.2 | 0.8 | 7.8 | 7.3 |
NGD | 2023-01-27 | 1.2 | 0.8 | 8.0 | 7.5 |
NGD | 2023-01-26 | 1.3 | 0.8 | 8.0 | 7.5 |
NGD | 2023-01-25 | 1.3 | 0.8 | 8.2 | 7.6 |
NGD | 2023-01-24 | 1.2 | 0.8 | 7.9 | 7.4 |
NGD Growth Metrics
- Its 2 year cash and equivalents growth rate is now at 7.77%.
- Its year over year net income to common stockholders growth rate is now at 423.12%.
- The 3 year net cashflow from operations growth rate now stands at 32.9%.

The table below shows NGD's growth in key financial areas (numbers in millions of US dollars).
Date | Revenue | Operating Cash Flow | Net Income to Common Stock |
---|---|---|---|
2022-09-30 | 644.2 | 264.6 | 101 |
2022-06-30 | 672.8 | 265.2 | 93.9 |
2022-03-31 | 755.3 | 338.1 | 116 |
2021-12-31 | 745.5 | 323.7 | 140.6 |
2021-12-31 | 745.5 | 323.7 | 140.6 |
2021-09-30 | 741.8 | 316.4 | -33.1 |
NGD's Quality Factors
The “Quality” component of the POWR Ratings focuses on 31 different factors of a companies fundamentals and operational strength. Here are some key insights as we drill into the specifics of these quality attributes.- NGD has a Quality Grade of C, ranking ahead of 58.98% of graded US stocks.
- NGD's asset turnover comes in at 0.322 -- ranking 21st of 42 Non-Metallic and Industrial Metal Mining stocks.
- IPI, OPNT, and UUUU are the stocks whose asset turnover ratios are most correlated with NGD.
The table below shows NGD's key quality metrics over time.
Period | Asset Turnover | Gross Margin | ROIC |
---|---|---|---|
2021-06-30 | 0.322 | 0.225 | 0.033 |
2021-03-31 | 0.277 | 0.204 | 0.016 |
2020-12-31 | 0.261 | 0.172 | 0.002 |
2020-12-31 | 0.261 | 0.172 | 0.002 |
2020-09-30 | 0.239 | 0.050 | -0.001 |
2020-06-30 | 0.241 | 0.007 | -0.018 |
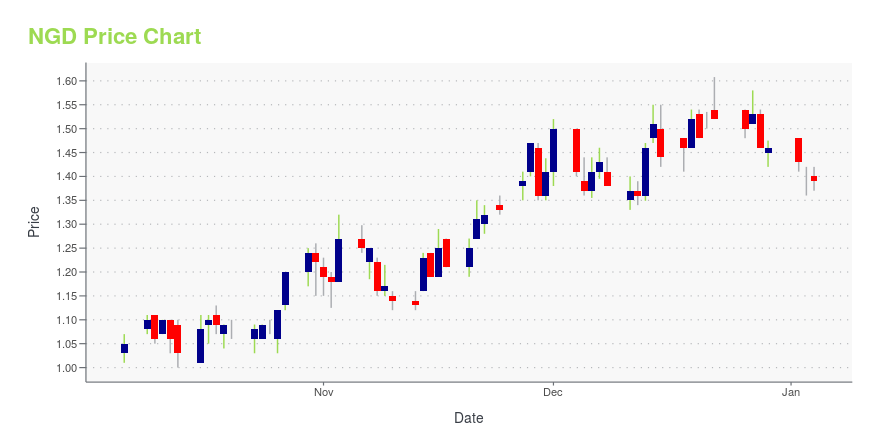
NGD Stock Price Chart Interactive Chart >
NGD Price/Volume Stats
Current price | $1.10 | 52-week high | $2.02 |
Prev. close | $1.16 | 52-week low | $0.61 |
Day low | $1.08 | Volume | 3,643,700 |
Day high | $1.14 | Avg. volume | 2,812,270 |
50-day MA | $1.09 | Dividend yield | N/A |
200-day MA | $1.03 | Market Cap | 750.50M |
New Gold Inc. (NGD) Company Bio
New Gold Inc. engages in the acquisition, exploration, development, and operation of mineral properties in Canada, United States, Australia, Mexico, and Chile. The company was founded in 1980 and is based in Vancouver, Canada.
Latest NGD News From Around the Web
Below are the latest news stories about NEW GOLD INC that investors may wish to consider to help them evaluate NGD as an investment opportunity.
Institutions own 41% of New Gold Inc. (TSE:NGD) shares but individual investors control 59% of the companyA look at the shareholders of New Gold Inc. ( TSE:NGD ) can tell us which group is most powerful. And the group that... |
New Gold: A Decent Fourth Quarter ProductionIntroductionOn January 10, 2023, Canada-based New Gold Inc. (NGD) released its fourth quarter 2022 operational results ending December 31, 2022. Note: This article is an update of my artic... |
New Gold Achieves Updated Production GuidanceNew Gold Inc. ("New Gold" or the "Company") (TSX: NGD) (NYSE American: NGD) reports fourth quarter and annual operational results for the Company as of December 31, 2022. The Company is also providing notice that it will release its fourth quarter and full year 2022 financial results and 2023 operational outlook before markets open on Thursday, February 16, 2023. |
Earnings growth of 2.4% over 5 years hasn't been enough to translate into positive returns for New Gold (TSE:NGD) shareholdersWhile not a mind-blowing move, it is good to see that the New Gold Inc. ( TSE:NGD ) share price has gained 10% in the... |
The 7 Best Penny Stocks to Buy NowConsider these seven names, a mix of growth and value plays, some of the best penny stocks to buy. |
NGD Price Returns
1-mo | 0.92% |
3-mo | 3.77% |
6-mo | 35.22% |
1-year | -30.38% |
3-year | 31.66% |
5-year | -60.43% |
YTD | 12.24% |
2022 | -34.67% |
2021 | -31.51% |
2020 | 148.86% |
2019 | 16.25% |
2018 | -76.99% |
Continue Researching NGD
Here are a few links from around the web to help you further your research on New Gold Inc's stock as an investment opportunity:New Gold Inc (NGD) Stock Price | Nasdaq
New Gold Inc (NGD) Stock Quote, History and News - Yahoo Finance
New Gold Inc (NGD) Stock Price and Basic Information | MarketWatch
Loading social stream, please wait...