
Natural Gas Services Group, Inc. (NGS): Price and Financial Metrics
NGS Price/Volume Stats
| Current price | $20.34 | 52-week high | $25.24 |
| Prev. close | $20.13 | 52-week low | $10.00 |
| Day low | $19.87 | Volume | 44,749 |
| Day high | $20.46 | Avg. volume | 73,394 |
| 50-day MA | $20.53 | Dividend yield | N/A |
| 200-day MA | $17.89 | Market Cap | 252.97M |
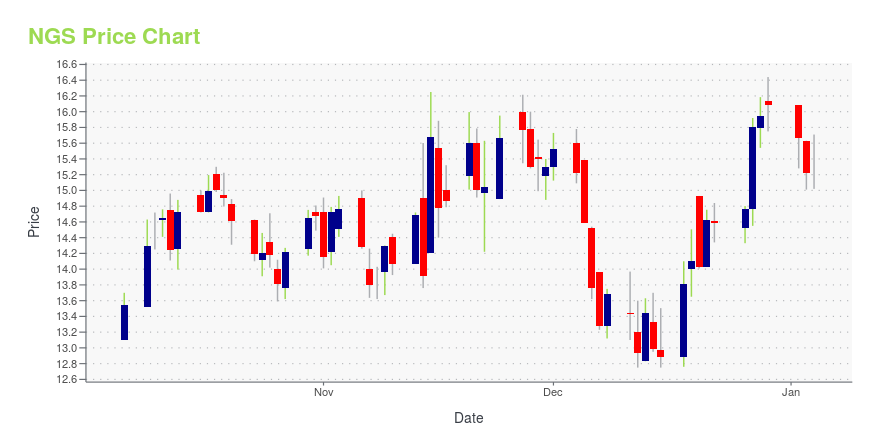
NGS Stock Price Chart Interactive Chart >
Natural Gas Services Group, Inc. (NGS) Company Bio
Natural Gas Services Group, Inc. provides small to medium horsepower compression equipment to the natural gas industry in the United States. The company rents small to medium horsepower compression equipment to non-conventional gas and oil production businesses, which include coal bed methane, gas shale, tight gas, and oil shales. The company was founded in 1998 and is based in Midland, Texas.
Latest NGS News From Around the Web
Below are the latest news stories about NATURAL GAS SERVICES GROUP INC that investors may wish to consider to help them evaluate NGS as an investment opportunity.
Natural Gas Services Group, Inc. (NYSE:NGS) Q3 2023 Earnings Call TranscriptNatural Gas Services Group, Inc. (NYSE:NGS) Q3 2023 Earnings Call Transcript November 20, 2023 Operator: Good morning, ladies and gentlemen, and welcome to the Natural Gas Services Group Inc. Quarter 3, 2023 Earnings Call. [Operator Instructions] I would now like to turn the call over to Ms. Anna Delgado. Please begin. Anna Delgado: Thank you, […] |
Q3 2023 Natural Gas Services Group Inc Earnings CallQ3 2023 Natural Gas Services Group Inc Earnings Call |
Natural Gas Services Group Inc (NGS) Reports Significant Revenue and Net Income Growth in Q3 2023Robust Rental Revenue and Operational Efficiency Drive Improved Financial Performance |
Natural Gas Services Group, Inc. Reports its Third Quarter 2023 Financial and Operating ResultsMidland, Texas, Nov. 14, 2023 (GLOBE NEWSWIRE) -- Third Quarter 2023 Highlights Rental revenue of $27.7 million, an increase of 49% when compared to the third quarter of 2022 and 15% when compared to the second quarter of 2023.Net income of $2.2 million, or $0.18 per basic share, as compared to a net loss of $80,000 in the third quarter of 2022 and net income of $504,000 in the second quarter of 2023.Adjusted EBITDA of $11.8 million, compared to $7.7 million in the third quarter of 2022 and $9.9 |
Natural Gas Services Group, Inc. Announces Third Quarter 2023 Earnings CallMidland, Texas, Nov. 06, 2023 (GLOBE NEWSWIRE) -- Natural Gas Services Group, Inc. (NYSE:NGS), a leading provider of natural gas compression equipment, technology and services to the energy industry, will host a conference call to review third-quarter 2023 financial results on Wednesday, November 15, 2023 at 10:00 a.m. (CST), 11:00 a.m. (EST). To participate in the call, participants should access the webcast on www.ngsgi.com under the Investor Relations section. To connect telephonically, call |
NGS Price Returns
| 1-mo | 6.88% |
| 3-mo | -14.50% |
| 6-mo | 30.97% |
| 1-year | 91.35% |
| 3-year | 120.61% |
| 5-year | 26.57% |
| YTD | 26.49% |
| 2023 | 40.31% |
| 2022 | 9.46% |
| 2021 | 10.44% |
| 2020 | -22.68% |
| 2019 | -25.43% |
Continue Researching NGS
Here are a few links from around the web to help you further your research on Natural Gas Services Group Inc's stock as an investment opportunity:Natural Gas Services Group Inc (NGS) Stock Price | Nasdaq
Natural Gas Services Group Inc (NGS) Stock Quote, History and News - Yahoo Finance
Natural Gas Services Group Inc (NGS) Stock Price and Basic Information | MarketWatch
Loading social stream, please wait...