
NantHealth, Inc. (NH): Price and Financial Metrics
NH Price/Volume Stats
| Current price | $1.35 | 52-week high | $9.75 |
| Prev. close | $2.53 | 52-week low | $1.24 |
| Day low | $1.35 | Volume | 232,400 |
| Day high | $2.39 | Avg. volume | 38,073 |
| 50-day MA | $2.06 | Dividend yield | N/A |
| 200-day MA | $3.99 | Market Cap | 10.40M |
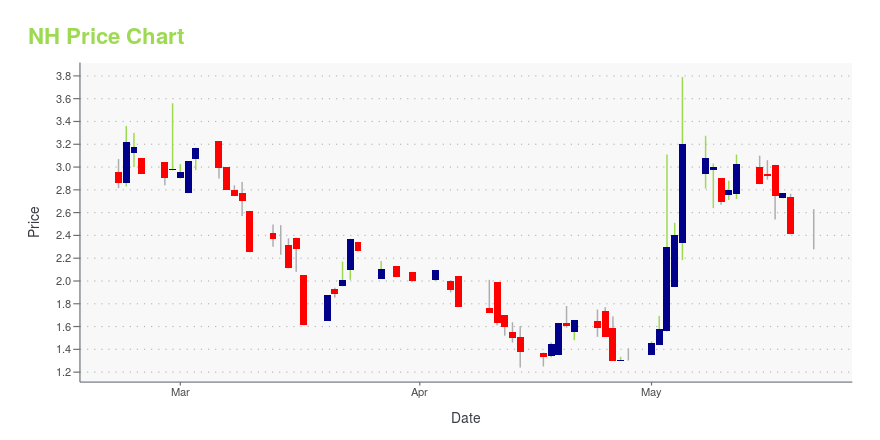
NH Stock Price Chart Interactive Chart >
NantHealth, Inc. (NH) Company Bio
NantHealth Inc. operates as a healthcare cloud-based information technology company. The Company offers a clinical platform that provide actionable health information at the point of care for critical illnesses. The company was founded in 2007 and is based in Culver City, California.
Latest NH News From Around the Web
Below are the latest news stories about NANTHEALTH INC that investors may wish to consider to help them evaluate NH as an investment opportunity.
Today’s Biggest Pre-Market Stock Movers: 10 Top Gainers and Losers on MondayPre-market stock movers are a hot topic on Monday as we dive into the biggest winners and losers traders need to know about this morning! |
Little Excitement Around NantHealth, Inc.'s (NASDAQ:NH) RevenuesYou may think that with a price-to-sales (or "P/S") ratio of 0.2x NantHealth, Inc. ( NASDAQ:NH ) is definitely a stock... |
NantHealth’s Eviti Connect Achieves HITRUST Risk-based, 2-year Certification to Further Mitigate Risk in Third-Party Privacy, Security and ComplianceMORRISVILLE, N.C., March 21, 2023--NantHealth, Inc. (NASDAQ-GS: NH), a leading provider of enterprise solutions transforming complex data into actionable insights, today announced its Eviti Connect solution has earned Certified status for information security by HITRUST. |
NantHealth Announces $22.5 Million New Financing with Highbridge and Nant CapitalMORRISVILLE, N.C., March 06, 2023--NantHealth, Inc. (NASDAQ-GS: NH), a leading provider of enterprise solutions that help businesses transform complex data into actionable insights, today announced the entry into a credit agreement for a new senior secured term loan in an aggregate principal amount of $22.5 million. The company intends to use the proceeds to continue funding its existing businesses and for general corporate purposes. The Term Loan Facility was funded by two existing NantHealth i |
OpenNMS releases OpenNMS Meridian 2023 with New Cloud-enabled CapabilitiesMORRISVILLE , N.C., February 22, 2023--The OpenNMS Group, Inc., a subsidiary of NantHealth, Inc. (NASDAQ: NH), today announced the release of OpenNMS Meridian 2023. With this major release, the fully open source Meridian product, which is the optimized and supported version of the OpenNMS platform curated by The OpenNMS Group, Inc. (OpenNMS) for production environments, now features cloud services, containerization benefits, and other advancements. |
NH Price Returns
| 1-mo | N/A |
| 3-mo | N/A |
| 6-mo | N/A |
| 1-year | N/A |
| 3-year | -95.43% |
| 5-year | -83.34% |
| YTD | N/A |
| 2023 | 0.00% |
| 2022 | -76.94% |
| 2021 | -67.34% |
| 2020 | 213.59% |
| 2019 | 90.74% |
Continue Researching NH
Want to do more research on NantHealth Inc's stock and its price? Try the links below:NantHealth Inc (NH) Stock Price | Nasdaq
NantHealth Inc (NH) Stock Quote, History and News - Yahoo Finance
NantHealth Inc (NH) Stock Price and Basic Information | MarketWatch
Loading social stream, please wait...