
Nautilus, Inc. (NLS): Price and Financial Metrics
NLS Price/Volume Stats
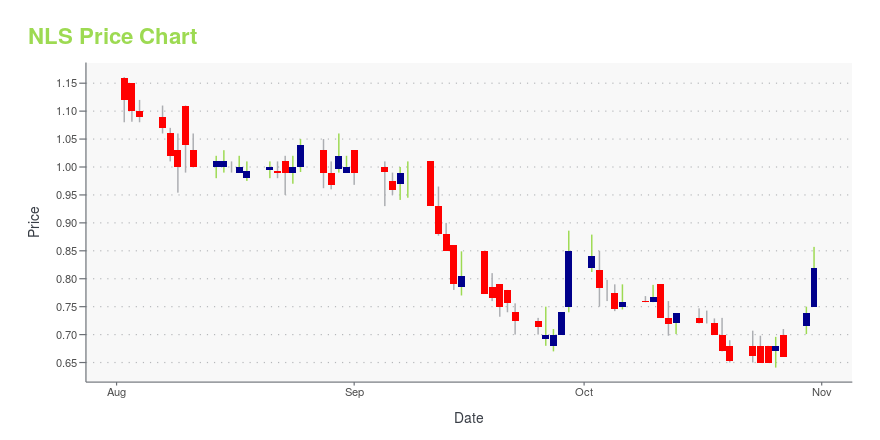
| Current price | $0.82 | 52-week high | $2.17 |
| Prev. close | $0.74 | 52-week low | $0.64 |
| Day low | $0.75 | Volume | 270,800 |
| Day high | $0.86 | Avg. volume | 189,439 |
| 50-day MA | $0.81 | Dividend yield | N/A |
| 200-day MA | $1.22 | Market Cap | 29.61M |
NLS Stock Price Chart Interactive Chart >
Nautilus, Inc. (NLS) Company Bio
Nautilus operates as a consumer fitness products company in the United States, Canada, and internationally. The company operates in two segments, Direct and Retail. It designs, develops, sources, and markets cardiovascular, and strength and nutrition fitness products, as well as related accessories for consumer use. The company was founded in 1986 and is based in Vancouver, Washington.
Latest NLS News From Around the Web
Below are the latest news stories about NAUTILUS INC that investors may wish to consider to help them evaluate NLS as an investment opportunity.
BowFlex Celebrates Holiday Season with Transformative New ProductsVANCOUVER, Wash., October 24, 2023--Breaking away from traditional fitness conventions, two new BowFlex® cardio machines put feeling good first. The BowFlex Max Trainer SE and the BowFlex IC Bike SE are engineered to accommodate all fitness levels and fit in any space, with intuitive features that are easy to adjust and sleek designs that are worthy of a place in your living room –– or anywhere else. |
Nautilus, Inc. Announces Plans to Change Corporate Name to BowFlex Inc.VANCOUVER, Wash., October 19, 2023--Nautilus, Inc. (NYSE: NLS) announced today plans to change its corporate name to BowFlex Inc., reflecting a focus on the Company’s strongest consumer brand, and continued execution of its growth transformation strategy, North Star. |
Longtime Portland-area company faces NYSE delistingNautilus (NYSE: NLS) announced Wednesday that it is at risk of being delisted from the New York Stock Exchange after its share price fell below $1 for 30 consecutive days. This notice is the start of a 180-day process for the exercise equipment company to regain minimum bid compliance, which it said it intends to do. Nautilus said it can regain compliance within that time period if it has both an average closing share price of $1 over the previous 30 trading days, and a closing share price of at least $1 on the last trading day of the month. |
BowFlex Parent, Nautilus, Inc. Announces Receipt of Notice of Non-Compliance with NYSE Trading Share Price Listing RuleVANCOUVER, Wash., September 27, 2023--Nautilus, Inc. (NYSE: NLS) ("Nautilus" or the "Company") today announced that on September 21, 2023, it received notice (the "Notice") from the New York Stock Exchange (the "NYSE") that the Company is not in compliance with applicable price criteria in the NYSE’s continued listing standard set forth in the NYSE Listed Company Manual because the average closing price of the Company’s Common Stock (the "Common Stock") was less than $1.00 per share over a conse |
Nautilus Inc. Debuts New Schwinn® 490 EllipticalVANCOUVER, Wash., September 19, 2023--Nautilus, Inc. (NYSE: NLS), the home fitness innovator for over 30 years, has elevated the elliptical category. And they’ve done it with help from their customers. The design of the new Schwinn® 490 Elliptical responds to customers’ requests for size, comfort, control, and workout capabilities in this type of trainer. The result is an elliptical that improves the workout experience and, more importantly, comes at a wallet-friendly price point. |
NLS Price Returns
| 1-mo | N/A |
| 3-mo | N/A |
| 6-mo | N/A |
| 1-year | -20.39% |
| 3-year | -94.76% |
| 5-year | -53.14% |
| YTD | N/A |
| 2023 | 0.00% |
| 2022 | -75.04% |
| 2021 | -66.21% |
| 2020 | 936.57% |
| 2019 | -83.94% |
Continue Researching NLS
Want to see what other sources are saying about Nautilus Inc's financials and stock price? Try the links below:Nautilus Inc (NLS) Stock Price | Nasdaq
Nautilus Inc (NLS) Stock Quote, History and News - Yahoo Finance
Nautilus Inc (NLS) Stock Price and Basic Information | MarketWatch
Loading social stream, please wait...