Netlist, Inc. (NLST): Price and Financial Metrics
NLST Price/Volume Stats
Current price | $1.62 | 52-week high | $6.10 |
Prev. close | $1.67 | 52-week low | $1.02 |
Day low | $1.56 | Volume | 209,400 |
Day high | $1.67 | Avg. volume | 479,731 |
50-day MA | $1.68 | Dividend yield | N/A |
200-day MA | $2.05 | Market Cap | 413.02M |
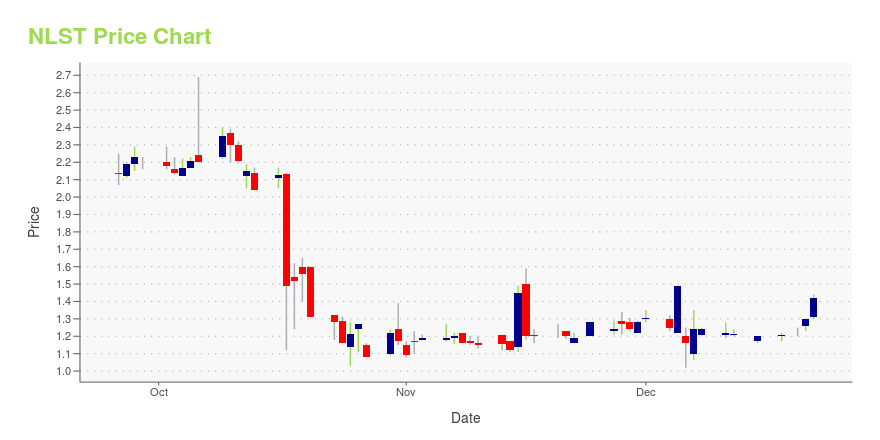
NLST Stock Price Chart Interactive Chart >
NLST POWR Grades
- NLST scores best on the Sentiment dimension, with a Sentiment rank ahead of 88.15% of US stocks.
- NLST's strongest trending metric is Growth; it's been moving up over the last 179 days.
- NLST's current lowest rank is in the Value metric (where it is better than 0.37% of US stocks).
NLST Stock Summary
- The ratio of debt to operating expenses for NETLIST INC is higher than it is for about merely 6.6% of US stocks.
- With a year-over-year growth in debt of -86.29%, NETLIST INC's debt growth rate surpasses merely 1.7% of about US stocks.
- As for revenue growth, note that NLST's revenue has grown -67.43% over the past 12 months; that beats the revenue growth of merely 3.22% of US companies in our set.
- If you're looking for stocks that are quantitatively similar to NETLIST INC, a group of peers worth examining would be SSRM, DM, AMWL, RIOT, and KN.
- Visit NLST's SEC page to see the company's official filings. To visit the company's web site, go to www.netlist.com.
NLST Valuation Summary
- In comparison to the median Technology stock, NLST's price/sales ratio is 103.7% higher, now standing at 5.5.
- NLST's price/sales ratio has moved up 4.1 over the prior 207 months.
Below are key valuation metrics over time for NLST.
Stock | Date | P/S | P/B | P/E | EV/EBIT |
---|---|---|---|---|---|
NLST | 2023-12-08 | 5.5 | 8.7 | -5.2 | -4.4 |
NLST | 2023-12-07 | 5.5 | 8.7 | -5.2 | -4.4 |
NLST | 2023-12-06 | 5.1 | 8.2 | -4.9 | -4.0 |
NLST | 2023-12-05 | 6.6 | 10.5 | -6.3 | -5.4 |
NLST | 2023-12-04 | 5.5 | 8.8 | -5.3 | -4.4 |
NLST | 2023-12-01 | 5.8 | 9.2 | -5.5 | -4.6 |
NLST Growth Metrics
- The 5 year cash and equivalents growth rate now stands at -20.76%.
- Its year over year net income to common stockholders growth rate is now at 130.55%.
- Its 4 year net income to common stockholders growth rate is now at 24.44%.
The table below shows NLST's growth in key financial areas (numbers in millions of US dollars).
Date | Revenue | Operating Cash Flow | Net Income to Common Stock |
---|---|---|---|
2022-09-30 | 176.328 | -31.783 | -28.642 |
2022-06-30 | 168.653 | -22.553 | -29.752 |
2022-03-31 | 177.658 | 11.515 | 2.976 |
2021-12-31 | 142.355 | 6.007 | 4.831 |
2021-09-30 | 117.494 | 18.875 | 11.285 |
2021-06-30 | 100.957 | 21.775 | 19.863 |
NLST's Quality Factors
The “Quality” component of the POWR Ratings focuses on 31 different factors of a companies fundamentals and operational strength. Here are some key insights as we drill into the specifics of these quality attributes.- NLST has a Quality Grade of A, ranking ahead of 99.39% of graded US stocks.
- NLST's asset turnover comes in at 2.399 -- ranking 1st of 208 Electronic Equipment stocks.
- MOSY, KULR, and CMTL are the stocks whose asset turnover ratios are most correlated with NLST.
The table below shows NLST's key quality metrics over time.
Period | Asset Turnover | Gross Margin | ROIC |
---|---|---|---|
2021-07-03 | 2.399 | 0.467 | 4.983 |
2021-04-03 | 1.637 | 0.129 | -0.959 |
2021-01-02 | 1.947 | 0.143 | -0.491 |
2020-09-26 | 1.922 | 0.149 | -0.386 |
2020-06-27 | 1.985 | 0.142 | -0.458 |
2020-03-28 | 1.787 | 0.123 | -0.545 |
Netlist, Inc. (NLST) Company Bio
Netlist, Inc. develops and manufactures computer memory subsystems. The Company markets its products to original equipment manufacturers for use in servers and the high performance computing and communications markets.
Latest NLST News From Around the Web
Below are the latest news stories about NETLIST INC that investors may wish to consider to help them evaluate NLST as an investment opportunity.
Netlist, Inc. (PNK:NLST) Q3 2023 Earnings Call TranscriptNetlist, Inc. (PNK:NLST) Q3 2023 Earnings Call Transcript October 31, 2023 Operator: Hello and welcome to the Netlist Third Quarter 2023 Earnings Conference Call and Webcast. All participants will be in listen-only mode. [Operator Instructions] After todays’ presentation, there will be an opportunity to ask questions. Please note this event is being recorded. I would […] |
Q3 2023 Netlist Inc Earnings CallQ3 2023 Netlist Inc Earnings Call |
Netlist, Inc. (NLST) Reports Q3 Loss, Tops Revenue EstimatesNetlist, Inc. (NLST) delivered earnings and revenue surprises of -40% and 39.38%, respectively, for the quarter ended September 2023. Do the numbers hold clues to what lies ahead for the stock? |
Netlist Reports Third Quarter 2023 ResultsIRVINE, CA / ACCESSWIRE / October 31, 2023 / Netlist, Inc. (OTCQB:NLST) today reported financial results for the third quarter ended September 30, 2023."Product revenue in the third quarter improved 67% on a sequential basis, as the memory market ... |
Netlist Schedules Third Quarter 2023 Financial Results and Conference CallIRVINE, CA / ACCESSWIRE / October 23, 2023 / Netlist, Inc. (OTCQB:NLST) announced today that it will report its financial results for the third quarter ended September 30, 2023, before 9:30 a.m. Eastern Time on Tuesday, October 31, 2023.Netlist will ... |
NLST Price Returns
1-mo | -0.31% |
3-mo | -13.83% |
6-mo | -25.69% |
1-year | -55.98% |
3-year | -7.43% |
5-year | 227.34% |
YTD | -13.83% |
2023 | 63.48% |
2022 | -82.17% |
2021 | 969.65% |
2020 | 101.00% |
2019 | -16.67% |
Continue Researching NLST
Want to see what other sources are saying about Netlist Inc's financials and stock price? Try the links below:Netlist Inc (NLST) Stock Price | Nasdaq
Netlist Inc (NLST) Stock Quote, History and News - Yahoo Finance
Netlist Inc (NLST) Stock Price and Basic Information | MarketWatch
Loading social stream, please wait...