Annaly Capital Management Inc (NLY): Price and Financial Metrics
GET POWR RATINGS... FREE!
NLY Price/Volume Stats
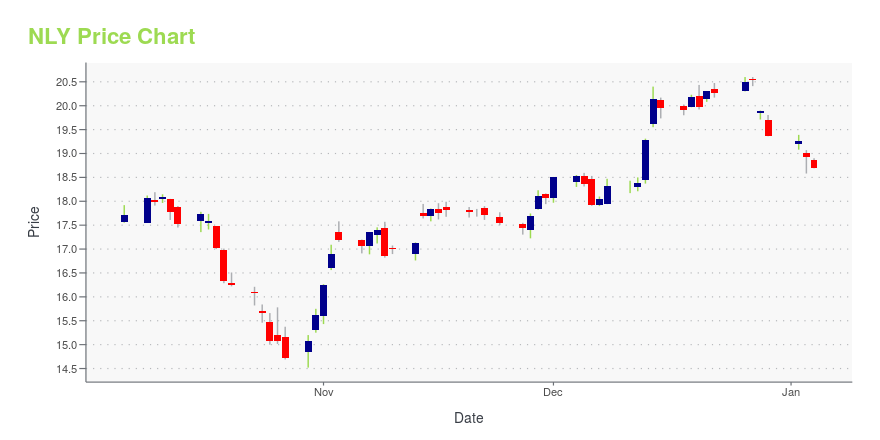
Current price | $18.44 | 52-week high | $27.96 |
Prev. close | $17.79 | 52-week low | $15.11 |
Day low | $17.70 | Volume | 3,856,800 |
Day high | $18.49 | Avg. volume | 5,276,744 |
50-day MA | $18.96 | Dividend yield | 14.28% |
200-day MA | $20.92 | Market Cap | 9.11B |
NLY Stock Price Chart Interactive Chart >
NLY POWR Grades
- NLY scores best on the Momentum dimension, with a Momentum rank ahead of 42.84% of US stocks.
- NLY's strongest trending metric is Stability; it's been moving up over the last 179 days.
- NLY's current lowest rank is in the Growth metric (where it is better than 3.21% of US stocks).
NLY Stock Summary
- For NLY, its debt to operating expenses ratio is greater than that reported by 99.91% of US equities we're observing.
- As for revenue growth, note that NLY's revenue has grown -133.41% over the past 12 months; that beats the revenue growth of only 0.39% of US companies in our set.
- ANNALY CAPITAL MANAGEMENT INC's shareholder yield -- a measure of how much capital is returned to stockholders via dividends and buybacks -- is -138.55%, greater than the shareholder yield of only 4.01% of stocks in our set.
- If you're looking for stocks that are quantitatively similar to ANNALY CAPITAL MANAGEMENT INC, a group of peers worth examining would be FMCC, FNMA, AGM, EARN, and IVR.
- NLY's SEC filings can be seen here. And to visit ANNALY CAPITAL MANAGEMENT INC's official web site, go to www.annaly.com.
NLY Valuation Summary
- In comparison to the median Real Estate stock, NLY's price/earnings ratio is 132.17% lower, now standing at -7.4.
- Over the past 243 months, NLY's price/sales ratio has gone down 18.6.
Below are key valuation metrics over time for NLY.
Stock | Date | P/S | P/B | P/E | EV/EBIT |
---|---|---|---|---|---|
NLY | 2023-05-11 | -9.8 | 0.8 | -7.4 | -70.4 |
NLY | 2023-05-10 | -9.8 | 0.8 | -7.4 | -70.4 |
NLY | 2023-05-09 | -9.7 | 0.8 | -7.4 | -70.4 |
NLY | 2023-05-08 | -9.9 | 0.8 | -7.5 | -70.5 |
NLY | 2023-05-05 | -9.9 | 0.8 | -7.5 | -70.5 |
NLY | 2023-05-04 | -9.7 | 0.8 | -7.3 | -70.3 |
NLY Growth Metrics
- Its 4 year price growth rate is now at -46.19%.
- Its 5 year revenue growth rate is now at -260.77%.
- Its 4 year revenue growth rate is now at -260.77%.

The table below shows NLY's growth in key financial areas (numbers in millions of US dollars).
Date | Revenue | Operating Cash Flow | Net Income to Common Stock |
---|---|---|---|
2022-12-31 | 1,934.72 | 5,372.411 | 1,614.702 |
2022-09-30 | 3,217.788 | 6,032.389 | 2,921.636 |
2022-06-30 | 4,000.582 | 4,222.647 | 3,716.144 |
2022-03-31 | 2,839.944 | 4,041.437 | 2,553.806 |
2021-12-31 | 2,528.988 | 3,076.839 | 2,282.364 |
2021-09-30 | 2,984.821 | 3,083.071 | 2,735.473 |
NLY's Quality Factors
The “Quality” component of the POWR Ratings focuses on 31 different factors of a companies fundamentals and operational strength. Here are some key insights as we drill into the specifics of these quality attributes.- NLY has a Quality Grade of B, ranking ahead of 80.08% of graded US stocks.
- NLY's asset turnover comes in at 0.041 -- ranking 309th of 444 Trading stocks.
- AGNC, SEB, and NTIP are the stocks whose asset turnover ratios are most correlated with NLY.
The table below shows NLY's key quality metrics over time.
Period | Asset Turnover | Gross Margin | ROIC |
---|---|---|---|
2021-06-30 | 0.041 | 1 | 0.022 |
2021-03-31 | 0.052 | 1 | 0.028 |
2020-12-31 | -0.008 | 1 | -0.006 |
2020-09-30 | -0.004 | 1 | -0.003 |
2020-06-30 | -0.019 | 1 | -0.011 |
2020-03-31 | -0.040 | 1 | -0.022 |
NLY Price Target
For more insight on analysts targets of NLY, see our NLY price target page. And for a list of of all stocks sorted by upside potential based on analyst target price, see our Top Price Target page.
Average Price Target | $8.95 | Average Broker Recommendation | 1.62 (Moderate Buy) |
Annaly Capital Management Inc (NLY) Company Bio
Annaly Capital Management Inc was founded in 1996 by a group of entrepreneurs, including Michael A. J. Farrell and Wellington J. Denahan. A year later, Annaly Capital completed a 102 million dollar initial public offering and is headquartered in New York City. The company is a real estate investment trust (REIT)and is a part of the real estate sector. As a mortgage real estate investment trust, it owns a portfolio of real estate related investments, including mortgage pass-through certificates and collateralized mortgage obligations. With $14 billion dollars in permanent capital, Annaly operates in two main sectors of the real estate economy: housing and commercial business. David L. Finklestein serves as the company’s Chief Investment Officer and Chief Executive Officer.
Latest NLY News From Around the Web
Below are the latest news stories about ANNALY CAPITAL MANAGEMENT INC that investors may wish to consider to help them evaluate NLY as an investment opportunity.
3 Housing Stocks That Will Benefit if Mortgage Rates Reverse CourseMortgage rates are on their way down, so here are the best housing stocks to buy based on their competitive positioning and financial health. |
Better Buy: AGNC Investment or Annaly Capital?Investors who are looking for high-yielding stocks should consider real estate investment trusts (REITs). Most of these companies invest in physical real estate, and because they are legally required to pay out at least 90% of their income as dividends annually, they often sport highly attractive yields. Mortgage REITs, though, are a little different from those that invest in commercial rental property. |
If You Invested $1,000 in Annaly Capital a Decade Ago, This Is How Much You Would Have TodayThere are two performance numbers to look at with Annaly, but neither one is all that great over the past 10 years. |
3 Monthly Dividend Stocks to Buy in May for a Passive Income StreamWhen markets go haywire, some of the best opportunities can be found in these top monthly dividend stocks to consider. |
Annaly Capital Management (NLY) Q1 2023 Earnings Call TranscriptContent referenced in today's call can be found in our first quarter 2023 investor presentation and first quarter 2023 financial supplement, both found under the Presentations section of our website. Participants on this morning's call include David Finkelstein, chief executive officer and chief investment officer; Serena Wolfe, chief financial officer; Mike Fania, deputy chief investment officer and head of residential credit; V.S. Srinivasan, head of agency; and Ken Adler, head of mortgage servicing rights. Good morning, and thank you all for joining us on our first quarter earnings call. |
NLY Price Returns
1-mo | -7.71% |
3-mo | -7.86% |
6-mo | -6.25% |
1-year | -18.69% |
3-year | 6.39% |
5-year | -18.68% |
YTD | -9.47% |
2022 | -21.41% |
2021 | 2.49% |
2020 | 2.38% |
2019 | 7.22% |
2018 | -7.22% |
NLY Dividends
Ex-Dividend Date | Type | Payout Amount | Change | ||||||
---|---|---|---|---|---|---|---|---|---|
Loading, please wait... |
Continue Researching NLY
Want to see what other sources are saying about Annaly Capital Management Inc's financials and stock price? Try the links below:Annaly Capital Management Inc (NLY) Stock Price | Nasdaq
Annaly Capital Management Inc (NLY) Stock Quote, History and News - Yahoo Finance
Annaly Capital Management Inc (NLY) Stock Price and Basic Information | MarketWatch
Loading social stream, please wait...