NMI Holdings Inc (NMIH): Price and Financial Metrics
NMIH Price/Volume Stats
Current price | $32.34 | 52-week high | $32.50 |
Prev. close | $32.11 | 52-week low | $21.38 |
Day low | $32.09 | Volume | 558,200 |
Day high | $32.44 | Avg. volume | 541,356 |
50-day MA | $30.35 | Dividend yield | N/A |
200-day MA | $28.42 | Market Cap | 2.61B |
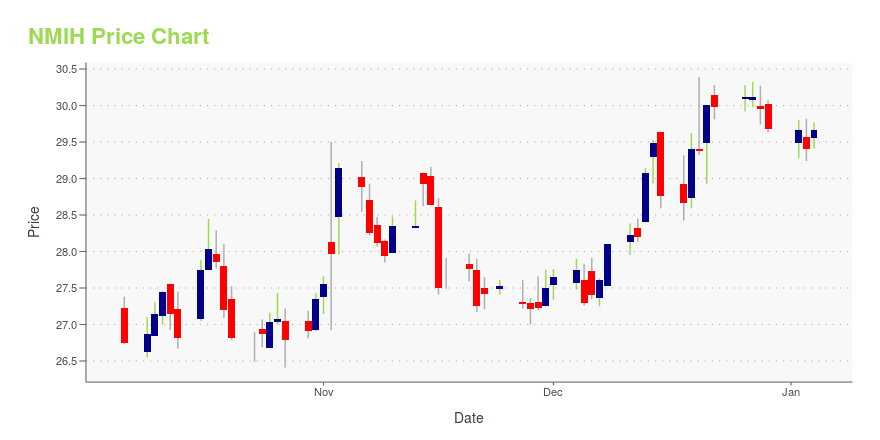
NMIH Stock Price Chart Interactive Chart >
NMIH POWR Grades
- NMIH scores best on the Momentum dimension, with a Momentum rank ahead of 90.65% of US stocks.
- The strongest trend for NMIH is in Growth, which has been heading up over the past 26 weeks.
- NMIH ranks lowest in Value; there it ranks in the 42nd percentile.
NMIH Stock Summary
- NMIH's current price/earnings ratio is 7.65, which is higher than only 11.9% of US stocks with positive earnings.
- Of note is the ratio of NMI HOLDINGS INC's sales and general administrative expense to its total operating expenses; 85.75% of US stocks have a lower such ratio.
- The ratio of debt to operating expenses for NMI HOLDINGS INC is higher than it is for about 77.23% of US stocks.
- Stocks with similar financial metrics, market capitalization, and price volatility to NMI HOLDINGS INC are MTG, KE, ESNT, HNNA, and CLW.
- Visit NMIH's SEC page to see the company's official filings. To visit the company's web site, go to www.nationalmi.com.
NMIH Valuation Summary
- In comparison to the median Financial Services stock, NMIH's price/earnings ratio is 29.09% lower, now standing at 7.8.
- NMIH's price/sales ratio has moved down 217.6 over the prior 123 months.
Below are key valuation metrics over time for NMIH.
Stock | Date | P/S | P/B | P/E | EV/EBIT |
---|---|---|---|---|---|
NMIH | 2023-12-22 | 4.3 | 1.4 | 7.8 | 6.1 |
NMIH | 2023-12-21 | 4.3 | 1.4 | 7.8 | 6.1 |
NMIH | 2023-12-20 | 4.2 | 1.3 | 7.6 | 6.0 |
NMIH | 2023-12-19 | 4.3 | 1.3 | 7.7 | 6.0 |
NMIH | 2023-12-18 | 4.1 | 1.3 | 7.5 | 5.9 |
NMIH | 2023-12-15 | 4.2 | 1.3 | 7.5 | 5.9 |
NMIH Growth Metrics
- Its 2 year net income to common stockholders growth rate is now at 24.62%.
- Its 2 year price growth rate is now at 25.52%.
- The 4 year net cashflow from operations growth rate now stands at 229.46%.
The table below shows NMIH's growth in key financial areas (numbers in millions of US dollars).
Date | Revenue | Operating Cash Flow | Net Income to Common Stock |
---|---|---|---|
2022-12-31 | 523.345 | 313.394 | 292.902 |
2022-09-30 | 515.31 | 325.941 | 280.486 |
2022-06-30 | 508.774 | 317.009 | 263.841 |
2022-03-31 | 497.319 | 320.565 | 245.919 |
2021-12-31 | 485.072 | 325.719 | 231.13 |
2021-09-30 | 469.903 | 319.002 | 218.874 |
NMIH's Quality Factors
The “Quality” component of the POWR Ratings focuses on 31 different factors of a companies fundamentals and operational strength. Here are some key insights as we drill into the specifics of these quality attributes.- NMIH has a Quality Grade of C, ranking ahead of 54.37% of graded US stocks.
- NMIH's asset turnover comes in at 0.207 -- ranking 79th of 133 Insurance stocks.
- PFG, ICCH, and RDN are the stocks whose asset turnover ratios are most correlated with NMIH.
The table below shows NMIH's key quality metrics over time.
Period | Asset Turnover | Gross Margin | ROIC |
---|---|---|---|
2021-09-30 | 0.207 | 0.965 | 0.122 |
2021-06-30 | 0.208 | 0.936 | 0.116 |
2021-03-31 | 0.208 | 0.867 | 0.107 |
2020-12-31 | 0.226 | 0.863 | 0.121 |
2020-09-30 | 0.249 | 0.860 | 0.135 |
2020-06-30 | 0.277 | 0.889 | 0.160 |
NMIH Price Target
For more insight on analysts targets of NMIH, see our NMIH price target page. And for a list of of all stocks sorted by upside potential based on analyst target price, see our Top Price Target page.
Average Price Target | $31.27 | Average Broker Recommendation | 1.41 (Moderate Buy) |
NMI Holdings Inc (NMIH) Company Bio
NMI Holdings, Inc. provides private mortgage guaranty insurance services in the United States. The company was founded in 2011 and is based in Emeryville, California.
Latest NMIH News From Around the Web
Below are the latest news stories about NMI HOLDINGS INC that investors may wish to consider to help them evaluate NMIH as an investment opportunity.
Next-Gen Riches: 3 Surprising Stock Picks to Boost Your $1,000 InvestmentAre you looking for the next-gen riches? |
3 Insurance Stocks That Have Outperformed the S&P 500 YTDInsurers Assurant (AIZ), Kinsale Capital (KNSL) and NMI Holdings (NMIH) outperform the industry, the sector and the S&P 500 composite and look poised to retain the rally. |
NMIH vs. BRK.B: Which Stock Is the Better Value Option?NMIH vs. BRK.B: Which Stock Is the Better Value Option? |
15 Best Mortgage Insurance Companies Heading into 2024In this article, we will look into the 15 best mortgage insurance companies heading into 2024. If you want to skip our detailed analysis, you can go directly to the 5 Best Mortgage Insurance Companies Heading into 2024. Mortgage Insurance Market Shift According to an article by National Mortgage News, published on August 7, 2023, […] |
Is NMI (NMIH) Stock Undervalued Right Now?Here at Zacks, our focus is on the proven Zacks Rank system, which emphasizes earnings estimates and estimate revisions to find great stocks. Nevertheless, we are always paying attention to the latest value, growth, and momentum trends to underscore strong picks. |
NMIH Price Returns
1-mo | 9.22% |
3-mo | 8.96% |
6-mo | 19.38% |
1-year | 47.81% |
3-year | 42.53% |
5-year | 25.01% |
YTD | 8.96% |
2023 | 42.01% |
2022 | -4.35% |
2021 | -3.53% |
2020 | -31.74% |
2019 | 85.88% |
Continue Researching NMIH
Want to see what other sources are saying about NMI Holdings Inc's financials and stock price? Try the links below:NMI Holdings Inc (NMIH) Stock Price | Nasdaq
NMI Holdings Inc (NMIH) Stock Quote, History and News - Yahoo Finance
NMI Holdings Inc (NMIH) Stock Price and Basic Information | MarketWatch
Loading social stream, please wait...