Nemaura Medical Inc. (NMRD): Price and Financial Metrics
NMRD Price/Volume Stats
Current price | $0.22 | 52-week high | $3.43 |
Prev. close | $0.22 | 52-week low | $0.21 |
Day low | $0.22 | Volume | 115,052 |
Day high | $0.26 | Avg. volume | 135,525 |
50-day MA | $0.27 | Dividend yield | N/A |
200-day MA | $0.63 | Market Cap | 6.36M |
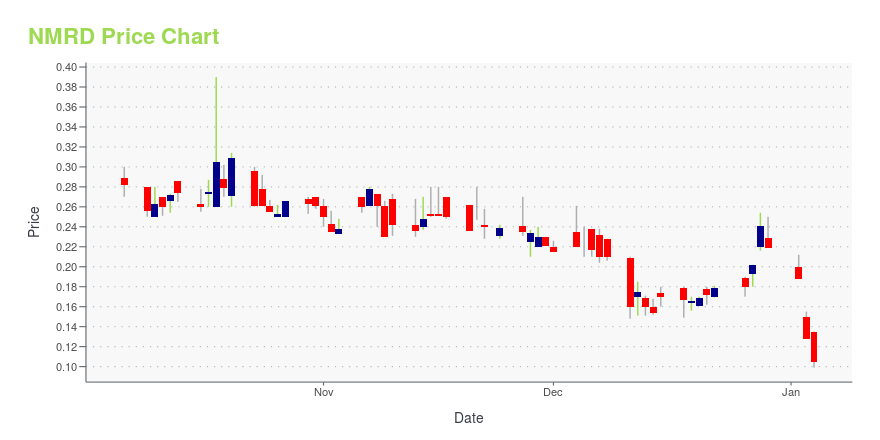
NMRD Stock Price Chart Interactive Chart >
NMRD Stock Summary
- With a market capitalization of $6,993,655, NEMAURA MEDICAL INC has a greater market value than only 4.81% of US stocks.
- With a price/sales ratio of 90.77, NEMAURA MEDICAL INC has a higher such ratio than 97.88% of stocks in our set.
- As for revenue growth, note that NMRD's revenue has grown -84.71% over the past 12 months; that beats the revenue growth of just 1.75% of US companies in our set.
- Stocks that are quantitatively similar to NMRD, based on their financial statements, market capitalization, and price volatility, are EBIX, ENVA, EMN, SEED, and ITGR.
- NMRD's SEC filings can be seen here. And to visit NEMAURA MEDICAL INC's official web site, go to nemauramedical.com.
NMRD Valuation Summary
- In comparison to the median Healthcare stock, NMRD's price/sales ratio is 5170.59% higher, now standing at 89.6.
- NMRD's price/earnings ratio has moved up 852.7 over the prior 108 months.
Below are key valuation metrics over time for NMRD.
Stock | Date | P/S | P/B | P/E | EV/EBIT |
---|---|---|---|---|---|
NMRD | 2023-11-03 | 89.6 | -0.5 | -0.5 | -2.8 |
NMRD | 2023-11-02 | 88.3 | -0.5 | -0.5 | -2.7 |
NMRD | 2023-11-01 | 93.5 | -0.5 | -0.6 | -2.8 |
NMRD | 2023-10-31 | 97.4 | -0.5 | -0.6 | -2.8 |
NMRD | 2023-10-30 | 98.7 | -0.5 | -0.6 | -2.9 |
NMRD | 2023-10-27 | 100.0 | -0.5 | -0.6 | -2.9 |
NMRD Growth Metrics
- Its 4 year price growth rate is now at -82.5%.
- Its 3 year net cashflow from operations growth rate is now at -82.65%.
- Its 2 year net cashflow from operations growth rate is now at -88.55%.

The table below shows NMRD's growth in key financial areas (numbers in millions of US dollars).
Date | Revenue | Operating Cash Flow | Net Income to Common Stock |
---|---|---|---|
2022-12-31 | 0.397322 | -8.240728 | -13.07814 |
2022-09-30 | 0.577933 | -7.577046 | -15.10659 |
2022-06-30 | 0.503906 | -7.198156 | -14.52238 |
2022-03-31 | 0.503906 | -6.504041 | -13.88681 |
2021-12-31 | 0.183628 | -5.712827 | -12.40018 |
2021-09-30 | 0 | -6.467909 | -10.41531 |
NMRD's Quality Factors
The “Quality” component of the POWR Ratings focuses on 31 different factors of a companies fundamentals and operational strength. Here are some key insights as we drill into the specifics of these quality attributes.- NMRD has a Quality Grade of D, ranking ahead of 8.07% of graded US stocks.
- NMRD's asset turnover comes in at 0 -- ranking 171st of 185 Medical Equipment stocks.
- SNN, EYE, and BAX are the stocks whose asset turnover ratios are most correlated with NMRD.
The table below shows NMRD's key quality metrics over time.
Period | Asset Turnover | Gross Margin | ROIC |
---|---|---|---|
2021-06-30 | 0 | NA | -0.496 |
2021-03-31 | 0 | NA | -0.595 |
2020-12-31 | 0 | NA | -1.908 |
2020-09-30 | 0 | NA | -2.821 |
2020-06-30 | 0 | NA | -6.854 |
2020-03-31 | 0 | NA | 9.198 |
NMRD Price Target
For more insight on analysts targets of NMRD, see our NMRD price target page. And for a list of of all stocks sorted by upside potential based on analyst target price, see our Top Price Target page.
Average Price Target | $15.00 | Average Broker Recommendation | 1.5 (Moderate Buy) |
Nemaura Medical Inc. (NMRD) Company Bio
Nemaura Medical Inc. designs and develops proprietary drug delivery platforms. The Company produces therapeutic delivery systems including patches and injectors. Nemaura Medical offers its products to the pharmaceutical and healthcare industries.
Latest NMRD News From Around the Web
Below are the latest news stories about NEMAURA MEDICAL INC that investors may wish to consider to help them evaluate NMRD as an investment opportunity.
Nemaura Medical Inc. Secures $10 Million Non-Dilutive Credit Facility to Fuel Strategic GrowthLoughborough, UK, Nov. 21, 2023 (GLOBE NEWSWIRE) -- Nemaura Medical Inc. (NASDAQ: NMRD) (“Nemaura Medical” or the “Company”), developer of a daily wear non-invasive glucose sensor, and digital healthcare programs is pleased to announce the execution of a strategic agreement for a $10 million credit facility which is expected to support the Company’s strategic growth plans. Recognizing the challenges associated with equity sales, particularly in the small-cap landscape on the Nasdaq, Nemaura Medi |
Nemaura (NMRD) to Expand in UK With Metabolic Health ProgramThe latest program leverages Nemaura's (NMRD) world-first daily wear non-invasive CGM technology, providing individuals with real-time insights into their body's glucose dynamics. |
Nemaura Medical First Half 2024 Earnings: US$0.13 loss per share (vs US$0.33 loss in 1H 2023)Nemaura Medical ( NASDAQ:NMRD ) First Half 2024 Results Key Financial Results Net loss: US$3.81m (loss narrowed by 52... |
Sidoti Events, LLC’s Virtual November Micro-Cap ConferenceNEW YORK, NY / ACCESSWIRE / November 14, 2023 / Sidoti Events, LLC, an affiliate of Sidoti & Company, LLC, has released the presentation schedule and weblinks for its two-day November Micro-Cap Conference taking place Wednesday and Thursday, November ... |
Nemaura Launches Direct to Consumer Offering of Metabolic Health Program in Combination with GLP-1 Weight Loss DrugsCompany CEO to discuss development at 1pm EST on 15th November 2023, at the Sidoti Virtual Investor Conference Loughborough, UK, Nov. 14, 2023 (GLOBE NEWSWIRE) -- Nemaura Medical, developer of a daily wear non-invasive glucose sensor, and digital healthcare programs today announced the UK launch of its ground-breaking approach to metabolic health and weight management by integrating continuous glucose monitoring (CGM) with its behavioral change program, Miboko, complemented by pharmaceutical int |
NMRD Price Returns
1-mo | -7.49% |
3-mo | -49.02% |
6-mo | -55.11% |
1-year | -89.72% |
3-year | -94.05% |
5-year | N/A |
YTD | -87.19% |
2022 | -62.34% |
2021 | 20.95% |
2020 | 7.71% |
2019 | -61.11% |
2018 | -82.35% |
Loading social stream, please wait...