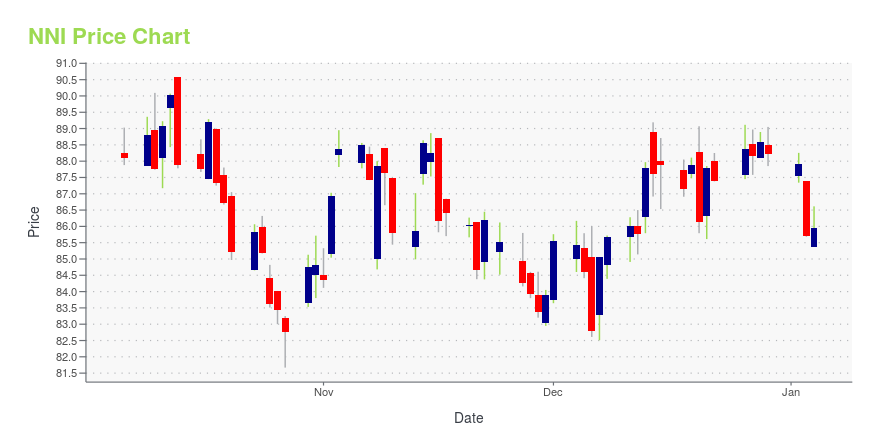
Nelnet, Inc. (NNI): Price and Financial Metrics
NNI Price/Volume Stats
Current price | $93.31 | 52-week high | $99.49 |
Prev. close | $93.32 | 52-week low | $72.94 |
Day low | $92.68 | Volume | 28,400 |
Day high | $93.33 | Avg. volume | 42,593 |
50-day MA | $92.89 | Dividend yield | 1.11% |
200-day MA | $90.61 | Market Cap | 3.48B |
NNI Stock Price Chart Interactive Chart >
NNI POWR Grades
- NNI scores best on the Quality dimension, with a Quality rank ahead of 75.52% of US stocks.
- NNI's strongest trending metric is Growth; it's been moving down over the last 179 days.
- NNI's current lowest rank is in the Growth metric (where it is better than 18.23% of US stocks).
NNI Stock Summary
- The ratio of debt to operating expenses for NELNET INC is higher than it is for about 95.84% of US stocks.
- In terms of volatility of its share price, NNI is more volatile than merely 7.65% of stocks we're observing.
- NELNET INC's shareholder yield -- a measure of how much capital is returned to stockholders via dividends and buybacks -- is 99.4%, greater than the shareholder yield of 97.75% of stocks in our set.
- Stocks with similar financial metrics, market capitalization, and price volatility to NELNET INC are OMF, WAFD, HBNC, KRNY, and BKU.
- Visit NNI's SEC page to see the company's official filings. To visit the company's web site, go to www.nelnet.com.
NNI Valuation Summary
- In comparison to the median Financial Services stock, NNI's EV/EBIT ratio is 375.93% higher, now standing at 51.4.
- Over the past 237 months, NNI's price/sales ratio has gone down 1.6.
Below are key valuation metrics over time for NNI.
Stock | Date | P/S | P/B | P/E | EV/EBIT |
---|---|---|---|---|---|
NNI | 2023-05-19 | 2.7 | 1.1 | 14.3 | 51.4 |
NNI | 2023-05-18 | 2.7 | 1.1 | 14.3 | 51.4 |
NNI | 2023-05-17 | 2.7 | 1.1 | 14.4 | 51.5 |
NNI | 2023-05-16 | 2.7 | 1.1 | 14.3 | 51.3 |
NNI | 2023-05-15 | 2.6 | 1.1 | 14.2 | 51.3 |
NNI | 2023-05-12 | 2.6 | 1.1 | 14.1 | 51.2 |
NNI Growth Metrics
- Its 3 year revenue growth rate is now at 45.63%.
- Its 2 year price growth rate is now at 73.39%.
- Its 2 year revenue growth rate is now at 53.36%.

The table below shows NNI's growth in key financial areas (numbers in millions of US dollars).
Date | Revenue | Operating Cash Flow | Net Income to Common Stock |
---|---|---|---|
2022-09-30 | 1,599.421 | 812.046 | 509.257 |
2022-06-30 | 1,494.723 | 840.97 | 457.597 |
2022-03-31 | 1,461.613 | 681.674 | 456.335 |
2021-12-31 | 1,337.107 | 544.867 | 393.286 |
2021-09-30 | 1,480.922 | 429.473 | 495.594 |
2021-06-30 | 1,512.73 | 506.027 | 513.959 |
NNI's Quality Factors
The “Quality” component of the POWR Ratings focuses on 31 different factors of a companies fundamentals and operational strength. Here are some key insights as we drill into the specifics of these quality attributes.- NNI has a Quality Grade of C, ranking ahead of 52.1% of graded US stocks.
- NNI's asset turnover comes in at 0.067 -- ranking 65th of 430 Banking stocks.
- GDOT, SLM, and ALLY are the stocks whose asset turnover ratios are most correlated with NNI.
The table below shows NNI's key quality metrics over time.
Period | Asset Turnover | Gross Margin | ROIC |
---|---|---|---|
2021-06-30 | 0.067 | 0.931 | 0.016 |
2021-03-31 | 0.068 | 0.932 | 0.016 |
2020-12-31 | 0.059 | 0.921 | 0.011 |
2020-09-30 | 0.047 | 0.902 | 0.005 |
2020-06-30 | 0.044 | 0.899 | 0.004 |
2020-03-31 | 0.040 | 0.890 | 0.002 |
NNI Price Target
For more insight on analysts targets of NNI, see our NNI price target page. And for a list of of all stocks sorted by upside potential based on analyst target price, see our Top Price Target page.
Average Price Target | $83.00 | Average Broker Recommendation | 1.5 (Moderate Buy) |
Nelnet, Inc. (NNI) Company Bio
Nelnet Inc. provides educational services in loan servicing, payment processing, education planning, and asset management in the United States. The company was founded in 1978 and is based in Lincoln, Nebraska.
Latest NNI News From Around the Web
Below are the latest news stories about NELNET INC that investors may wish to consider to help them evaluate NNI as an investment opportunity.
Nelnet First Quarter 2023 Earnings: EPS: US$0.71 (vs US$4.91 in 1Q 2022)Nelnet ( NYSE:NNI ) First Quarter 2023 Results Key Financial Results Revenue: US$297.4m (down 38% from 1Q 2022). Net... |
Nelnet Reports First Quarter 2023 ResultsNelnet (NYSE: NNI) today reported GAAP net income of $26.5 million, or $0.71 per share, for the first quarter of 2023, compared with GAAP net income of $186.6 million, or $4.91 per share, for the same period a year ago. |
Nelnet Awarded U.S. Department of Education's USDS Loan Servicing ContractNelnet (NYSE: NNI) today announced its Nelnet Diversified Services division has been awarded a Unified Servicing and Data Solution (USDS) contract by the United States Department of Education (Department) Office of Federal Student Aid (FSA). |
With 49% ownership, Nelnet, Inc. (NYSE:NNI) insiders have a lot riding on the company's futureKey Insights Significant insider control over Nelnet implies vested interests in company growth The top 5 shareholders... |
Worried About Bank Stocks? Here Are 2 Ultra Resilient Financial Companies to Buy Right NowWith the rapid failures of Silicon Valley Bank and Signature Bank in recent weeks, businesses that seemed to be sound and running smoothly have wiped out shareholders. This has led to an investor exodus from the banking sector, with regional bank stocks, based on the Invesco KBW Regional Banking exchange-traded fund, down roughly 20% this year. Operating for 172 years, American Express (NYSE: AXP) is one of the oldest consumer lending businesses still operating today. |
NNI Price Returns
1-mo | -3.16% |
3-mo | 3.51% |
6-mo | -5.08% |
1-year | 11.41% |
3-year | 95.99% |
5-year | 59.68% |
YTD | 3.40% |
2022 | -6.04% |
2021 | 38.71% |
2020 | 24.01% |
2019 | 12.66% |
2018 | -3.32% |
NNI Dividends
Ex-Dividend Date | Type | Payout Amount | Change | ||||||
---|---|---|---|---|---|---|---|---|---|
Loading, please wait... |
Continue Researching NNI
Want to do more research on Nelnet Inc's stock and its price? Try the links below:Nelnet Inc (NNI) Stock Price | Nasdaq
Nelnet Inc (NNI) Stock Quote, History and News - Yahoo Finance
Nelnet Inc (NNI) Stock Price and Basic Information | MarketWatch
Loading social stream, please wait...