Northern Oil and Gas, Inc. (NOG): Price and Financial Metrics
GET POWR RATINGS... FREE!
NOG POWR Grades
- Momentum is the dimension where NOG ranks best; there it ranks ahead of 87.27% of US stocks.
- NOG's strongest trending metric is Growth; it's been moving down over the last 177 days.
- NOG ranks lowest in Stability; there it ranks in the 6th percentile.
NOG Stock Summary
- With a price/earnings ratio of 3.17, NORTHERN OIL & GAS INC P/E ratio is greater than that of about only 4.44% of stocks in our set with positive earnings.
- In terms of twelve month growth in earnings before interest and taxes, NORTHERN OIL & GAS INC is reporting a growth rate of -445.92%; that's higher than just 3.7% of US stocks.
- Revenue growth over the past 12 months for NORTHERN OIL & GAS INC comes in at 567.01%, a number that bests 98.13% of the US stocks we're tracking.
- If you're looking for stocks that are quantitatively similar to NORTHERN OIL & GAS INC, a group of peers worth examining would be TALO, EQT, OSG, AIV, and CRK.
- NOG's SEC filings can be seen here. And to visit NORTHERN OIL & GAS INC's official web site, go to www.northernoil.com.
NOG Valuation Summary
- In comparison to the median Energy stock, NOG's EV/EBIT ratio is 55.67% lower, now standing at 4.5.
- Over the past 192 months, NOG's price/earnings ratio has gone up 1178.3.
Below are key valuation metrics over time for NOG.
Stock | Date | P/S | P/B | P/E | EV/EBIT |
---|---|---|---|---|---|
NOG | 2023-01-13 | 1.6 | 3.5 | 3.3 | 4.5 |
NOG | 2023-01-12 | 1.6 | 3.4 | 3.2 | 4.4 |
NOG | 2023-01-11 | 1.6 | 3.4 | 3.1 | 4.4 |
NOG | 2023-01-10 | 1.6 | 3.4 | 3.1 | 4.4 |
NOG | 2023-01-09 | 1.6 | 3.4 | 3.1 | 4.4 |
NOG | 2023-01-06 | 1.5 | 3.2 | 3.0 | 4.3 |
NOG Growth Metrics
- Its 5 year cash and equivalents growth rate is now at 54.24%.
- Its year over year net cashflow from operations growth rate is now at 66.01%.
- Its 2 year revenue growth rate is now at -55.12%.

The table below shows NOG's growth in key financial areas (numbers in millions of US dollars).
Date | Revenue | Operating Cash Flow | Net Income to Common Stock |
---|---|---|---|
2022-09-30 | 1,519.346 | 774.141 | 765.534 |
2022-06-30 | 859.213 | 591.788 | 193.628 |
2022-03-31 | 442.572 | 487.735 | -138.745 |
2021-12-31 | 496.899 | 396.467 | -8.4 |
2021-09-30 | 227.784 | 336.398 | -325.924 |
2021-06-30 | 143.599 | 298.398 | -571.595 |
NOG's Quality Factors
The “Quality” component of the POWR Ratings focuses on 31 different factors of a companies fundamentals and operational strength. Here are some key insights as we drill into the specifics of these quality attributes.- NOG has a Quality Grade of C, ranking ahead of 60.4% of graded US stocks.
- NOG's asset turnover comes in at 0.149 -- ranking 120th of 137 Petroleum and Natural Gas stocks.
- PDCE, MUR, and PXD are the stocks whose asset turnover ratios are most correlated with NOG.
The table below shows NOG's key quality metrics over time.
Period | Asset Turnover | Gross Margin | ROIC |
---|---|---|---|
2021-06-30 | 0.149 | -0.235 | -0.286 |
2021-03-31 | 0.066 | -1.165 | -0.728 |
2020-12-31 | 0.409 | 0.735 | -0.394 |
2020-09-30 | 0.349 | 0.714 | -0.329 |
2020-06-30 | 0.409 | 0.763 | -0.175 |
2020-03-31 | 0.523 | 0.809 | 0.177 |
NOG Stock Price Chart Interactive Chart >
NOG Price/Volume Stats
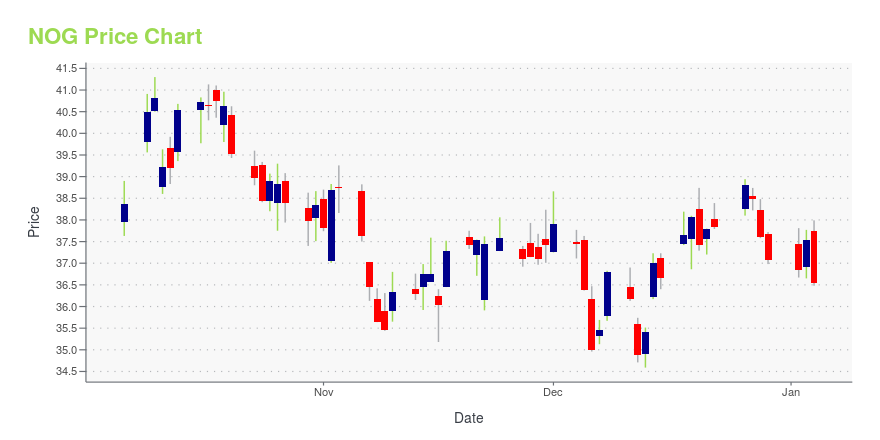
Current price | $33.42 | 52-week high | $39.10 |
Prev. close | $31.21 | 52-week low | $21.45 |
Day low | $31.24 | Volume | 2,317,100 |
Day high | $33.42 | Avg. volume | 2,211,020 |
50-day MA | $32.16 | Dividend yield | 3.84% |
200-day MA | $30.60 | Market Cap | 2.60B |
Northern Oil and Gas, Inc. (NOG) Company Bio
Northern Oil and Gas, Inc. engages in the acquisition, exploration, development, and production of oil and natural gas properties in the United States. The company is based in Wayzata, Minnesota.
Latest NOG News From Around the Web
Below are the latest news stories about NORTHERN OIL & GAS INC that investors may wish to consider to help them evaluate NOG as an investment opportunity.
NOG Declares $0.34 Quarterly Cash Dividend, 13% Increase over Prior Quarter; Provides Operations and Shareholder Return UpdatesMINNEAPOLIS, February 06, 2023--NOG Declares $0.34 Quarterly Cash Dividend, 13% Increase over Prior Quarter Provides Operations and Shareholder Return Updates |
Facts About: Micron Technology, Inc. (NASDAQ:MU 3.81%), Northern Oil and Gas, Inc. (NYSE:NOG -1.76%)MU has seen its SMA50 which is now 12.33%. In looking the SMA 200 we see that the stock has seen a 5.48%. NOG has seen its SMA50 which is … The post Facts About: Micron Technology, Inc. (NASDAQ:MU 3.81%), Northern Oil and Gas, Inc. (NYSE:NOG -1.76%) appeared first on Stocks Equity . |
American Express, Visa And Other Big Stocks Moving Higher In Friday''s Pre-Market SessionU.S. stock futures traded slightly lower this morning. Here are some big stocks recording gains in today’s pre-market trading session. Bridger Aerospace Group Holdings, LLC (NASDAQ: BAER ) climbed 7.5% to $20.19 in pre-market trading. Bridger closed merger agreement with Jack Creek Investment Corp on Tuesday. Northern Oil and Gas, Inc. (NYSE: NOG ) climbed 6.5% to $35.50 in pre-market trading. Northern Oil and Gas will replace South Jersey Industries in the S&P SmallCap 600 effective prior to the opening of trading on … Full story available on Benzinga.com |
Have you been able to find a good deal on Northern Oil and Gas Inc.’s shares?The share price of Northern Oil and Gas Inc. (NYSE:NOG) rose to $33.32 per share on Thursday from $32.11. While Northern Oil and Gas Inc. has overperformed by 3.77%, investors are advised to look at stock chart patterns for technical insight. Within its last year performance, NOG rose by 45.31%, with highs and lows ranging […] |
Northern Oil and Gas jumps 7% on SmallCap 600 index inclusion (NYSE:NOG)Northern Oil and Gas stock (NOG) has jumped 7.4% after hours following news that it''s entering the S&P SmallCap 600 index |
NOG Price Returns
1-mo | 13.10% |
3-mo | -1.93% |
6-mo | 14.53% |
1-year | 42.72% |
3-year | 109.30% |
5-year | 114.47% |
YTD | 8.44% |
2022 | 54.51% |
2021 | 136.72% |
2020 | -62.56% |
2019 | 3.54% |
2018 | 10.24% |
NOG Dividends
Ex-Dividend Date | Type | Payout Amount | Change | ||||||
---|---|---|---|---|---|---|---|---|---|
Loading, please wait... |
Continue Researching NOG
Here are a few links from around the web to help you further your research on Northern Oil & Gas Inc's stock as an investment opportunity:Northern Oil & Gas Inc (NOG) Stock Price | Nasdaq
Northern Oil & Gas Inc (NOG) Stock Quote, History and News - Yahoo Finance
Northern Oil & Gas Inc (NOG) Stock Price and Basic Information | MarketWatch
Loading social stream, please wait...