National Oilwell Varco, Inc. (NOV): Price and Financial Metrics
GET POWR RATINGS... FREE!
NOV POWR Grades
- NOV scores best on the Momentum dimension, with a Momentum rank ahead of 97.54% of US stocks.
- NOV's strongest trending metric is Value; it's been moving down over the last 179 days.
- NOV ranks lowest in Sentiment; there it ranks in the 7th percentile.
NOV Stock Summary
- Of note is the ratio of NOV Inc's sales and general administrative expense to its total operating expenses; 85.61% of US stocks have a lower such ratio.
- In terms of twelve month growth in earnings before interest and taxes, NOV Inc is reporting a growth rate of -94.15%; that's higher than merely 19.35% of US stocks.
- Revenue growth over the past 12 months for NOV Inc comes in at -9.29%, a number that bests only 11.15% of the US stocks we're tracking.
- Stocks with similar financial metrics, market capitalization, and price volatility to NOV Inc are AZEK, NR, G, VEC, and LEA.
- NOV's SEC filings can be seen here. And to visit NOV Inc's official web site, go to www.nov.com.
NOV Valuation Summary
- NOV's price/sales ratio is 0.9; this is 40% lower than that of the median Energy stock.
- NOV's price/earnings ratio has moved down 28.9 over the prior 243 months.
- Over the past 243 months, NOV's price/sales ratio has gone down 0.
Below are key valuation metrics over time for NOV.
Stock | Date | P/S | P/B | P/E | EV/EBIT |
---|---|---|---|---|---|
NOV | 2021-09-03 | 0.9 | 1 | -9.3 | -11.6 |
NOV | 2021-09-02 | 1.0 | 1 | -9.6 | -11.9 |
NOV | 2021-09-01 | 0.9 | 1 | -9.3 | -11.6 |
NOV | 2021-08-31 | 1.0 | 1 | -9.5 | -11.8 |
NOV | 2021-08-30 | 1.0 | 1 | -9.6 | -11.8 |
NOV | 2021-08-27 | 1.0 | 1 | -9.9 | -12.2 |
NOV Growth Metrics
- Its 2 year revenue growth rate is now at 14.46%.
- Its 2 year net income to common stockholders growth rate is now at -4307.1%.
- Its 3 year price growth rate is now at -17.69%.

The table below shows NOV's growth in key financial areas (numbers in millions of US dollars).
Date | Revenue | Operating Cash Flow | Net Income to Common Stock |
---|---|---|---|
2021-12-31 | 5,524 | 291 | -250 |
2021-09-30 | 5,334 | 441 | -557 |
2021-06-30 | 5,377 | 659 | -543 |
2021-03-31 | 5,456 | 860 | -610 |
2020-12-31 | 6,090 | 926 | -2,542 |
2020-09-30 | 7,044 | 1,213 | -2,580 |
NOV's Quality Factors
The “Quality” component of the POWR Ratings focuses on 31 different factors of a companies fundamentals and operational strength. Here are some key insights as we drill into the specifics of these quality attributes.- NOV has a Quality Grade of C, ranking ahead of 42.2% of graded US stocks.
- NOV's asset turnover comes in at 0.55 -- ranking 78th of 104 Machinery stocks.
- TGEN, LNN, and KRNT are the stocks whose asset turnover ratios are most correlated with NOV.
The table below shows NOV's key quality metrics over time.
Period | Asset Turnover | Gross Margin | ROIC |
---|---|---|---|
2021-09-30 | 0.550 | 0.095 | -0.069 |
2021-06-30 | 0.546 | 0.086 | -0.074 |
2021-03-31 | 0.543 | 0.067 | -0.086 |
2020-12-31 | 0.591 | 0.071 | -0.358 |
2020-09-30 | 0.634 | 0.124 | -0.349 |
2020-06-30 | 0.645 | 0.114 | -0.333 |
NOV Price Target
For more insight on analysts targets of NOV, see our NOV price target page. And for a list of of all stocks sorted by upside potential based on analyst target price, see our Top Price Target page.
Average Price Target | $17.58 | Average Broker Recommendation | 1.67 (Moderate Buy) |
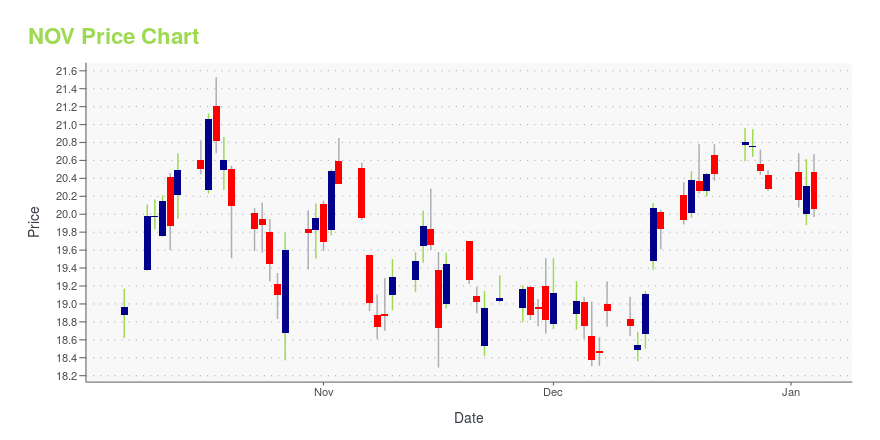
NOV Stock Price Chart Interactive Chart >
NOV Price/Volume Stats
Current price | $16.23 | 52-week high | $24.06 |
Prev. close | $15.60 | 52-week low | $11.46 |
Day low | $15.59 | Volume | 6,431,200 |
Day high | $16.43 | Avg. volume | 4,666,045 |
50-day MA | $18.82 | Dividend yield | 1.23% |
200-day MA | $16.36 | Market Cap | 6.38B |
National Oilwell Varco, Inc. (NOV) Company Bio
National Oilwell Varco designs, manufactures, and sells equipment and components used in oil and gas drilling, completion, and production; and provides oilfield services to the upstream oil and gas industry worldwide. The company was founded in 1862 and is based in Houston, Texas.
Latest NOV News From Around the Web
Below are the latest news stories about NOV Inc that investors may wish to consider to help them evaluate NOV as an investment opportunity.
Thursday’s Top Analysts Upgrades and Downgrades: Caesars Entertainment, Chevron, Exact Sciences, Exxon Mobil, Gap, Ginkgo Bioworks, Home Depot, New York Mortgage Trust, Novavax, NOV, SoFi Technologies and MoreThursday''s top analyst upgrades and downgrades included Caesars Entertainment, Chevron, Exact Sciences, Exxon Mobil, Gap, Ginkgo Bioworks, Home Depot, New York Mortgage Trust, Novavax, NOV and SoFi Technologies. |
NOV cut to Sell at Goldman Sachs after trading at premium to OFS peersNOV Inc. (NOV) -2.9% pre-market after Goldman Sachs downgrades shares to Sell from Neutral with a $16 price target, saying the stock currently trades at a premium to oilfield |
NOV Inc. – Consensus Indicates Potential 5.7% UpsideNOV Inc. found using ticker (NOV) now have 10 analysts in total covering the stock. The consensus rating is ''Buy''. The range between the high target price and low target price is between 22 and 14 calculating the average target price we see 18.15. Given that the stocks previous close was at 17.17 this indicates there is a potential upside of 5.7%. The 50 day moving average now sits at 15.15 and the 200 day moving average is 14.6. The company has a market capitalisation of $6,742m. Find out more information at: https://www.nov.com [stock_market_widget type="chart" template="basic" color="green" assets=NOV" range="6mo" interval="1d" axes="true" cursor="true" api="yf"] The potential market cap would be $7,127m based on the market concensus. NOV Inc. designs, constructs, manufactures, and... |
Tuesdays Top Analyst Upgrades and Downgrades: Apple, Continental Resources, Bilibili, Eaton, Hershey, Meta Platforms, Nio, NOV, PayPal, Southern Company and MoreTuesday''s top analyst upgrades and downgrades included Apple, Continental Resources, Bilibili, Eaton, Hershey, Meta Platforms, Nio, NOV, PayPal and Southern Company. |
Border to Coast Pensions Partnership Ltd Buys PayPal Holdings Inc, Big Lots Inc, Fiserv Inc, ...Investment company Border to Coast Pensions Partnership Ltd (Current Portfolio) buys PayPal Holdings Inc, Big Lots Inc, Fiserv Inc, NOV Inc, Mastercard Inc, sells Peloton Interactive Inc, Alliance Data Systems Corp, Alibaba Group Holding, M&T Bank Corp, Canada Goose Holdings Inc during the 3-months ended 2021Q4, according to the most recent filings of the investment company, Border to Coast Pensions Partnership Ltd. |
NOV Price Returns
1-mo | -17.75% |
3-mo | -18.45% |
6-mo | 19.81% |
1-year | 4.58% |
3-year | -23.42% |
5-year | -47.36% |
YTD | 20.35% |
2021 | -0.89% |
2020 | -44.93% |
2019 | -1.69% |
2018 | -28.28% |
2017 | -3.23% |
NOV Dividends
Ex-Dividend Date | Type | Payout Amount | Change | ||||||
---|---|---|---|---|---|---|---|---|---|
Loading, please wait... |
Continue Researching NOV
Here are a few links from around the web to help you further your research on National Oilwell Varco Inc's stock as an investment opportunity:National Oilwell Varco Inc (NOV) Stock Price | Nasdaq
National Oilwell Varco Inc (NOV) Stock Quote, History and News - Yahoo Finance
National Oilwell Varco Inc (NOV) Stock Price and Basic Information | MarketWatch
Loading social stream, please wait...