
Novan, Inc. (NOVN): Price and Financial Metrics
NOVN Price/Volume Stats
| Current price | $0.09 | 52-week high | $3.33 |
| Prev. close | $0.13 | 52-week low | $0.08 |
| Day low | $0.08 | Volume | 7,190,000 |
| Day high | $0.14 | Avg. volume | 602,421 |
| 50-day MA | $0.73 | Dividend yield | N/A |
| 200-day MA | $1.13 | Market Cap | 2.64M |
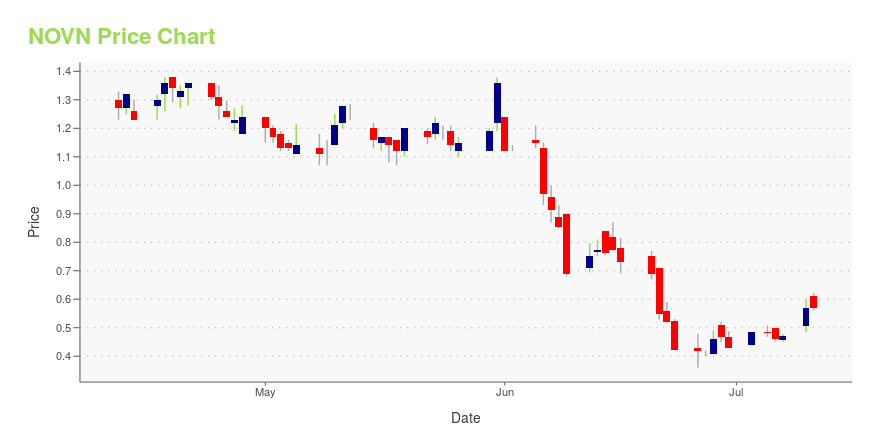
NOVN Stock Price Chart Interactive Chart >
Novan, Inc. (NOVN) Company Bio
Novan, Inc. focuses on the development and commercialization of nitric oxide-based therapies in dermatology. Its lead product candidate is SB204, a cosmetically elegant topical gel that targets multiple mechanisms of action for the treatment of acne vulgaris. The company was founded in 2006 and is based in Durham, North Carolina.
Latest NOVN News From Around the Web
Below are the latest news stories about NOVAN INC that investors may wish to consider to help them evaluate NOVN as an investment opportunity.
Today’s Biggest Pre-Market Stock Movers: 10 Top Gainers and Losers on TuesdayWe're starting Thursday with a detailed look at all of the biggest pre-market stock movers worth keeping an eye on today! |
Investors Holding Back On Novan, Inc. (NASDAQ:NOVN)Novan, Inc.'s ( NASDAQ:NOVN ) price-to-sales (or "P/S") ratio of 1.1x might make it look like a buy right now compared... |
Novan to Provide Corporate Update at its 2023 Annual Meeting of StockholdersDURHAM, N.C., June 05, 2023 (GLOBE NEWSWIRE) -- Novan, Inc. (“the Company” or “Novan”) (Nasdaq: NOVN), today announced that it will host a live audio webcast of the Company’s 2023 Annual Meeting of Stockholders (“ASM”) being held on Tuesday, June 6, 2023 at 9:30 a.m. Eastern Time in a virtual format. The Company also announced that its Chairman, President and CEO, Paula Brown Stafford, will provide a corporate update on the Company after the conclusion of the ASM, including the Company’s current |
Novan Focuses Strategic Direction and Announces Restructuring– Company directing resources on the potential approval of berdazimer gel, 10.3% (SB206) for molluscum contagiosum – – Process to explore a sale or out-license of commercial assets or other business transaction continues – – Continued progress toward PDUFA goal date of January 5, 2024, for berdazimer gel, 10.3% – DURHAM, N.C., May 31, 2023 (GLOBE NEWSWIRE) -- Novan, Inc. (“the Company” or “Novan”) (Nasdaq: NOVN), today announced that following an evaluation of its commercial and developmental st |
NOVN: Counting Down to PDUFABy John Vandermosten, CFA NASDAQ:NOVN READ THE FULL NOVN RESEARCH REPORT 1Q:23 Financial and Operational Results On May 15th, 2023, Novan Inc. (NASDAQ:NOVN) reported 1Q:23 financial and operational results in a press release and in the filing of Form 10-Q . A conference call and webcast were subsequently held to update investors on recent developments. The call highlighted the performance of the |
NOVN Price Returns
| 1-mo | N/A |
| 3-mo | N/A |
| 6-mo | N/A |
| 1-year | N/A |
| 3-year | -98.88% |
| 5-year | -99.65% |
| YTD | N/A |
| 2023 | 0.00% |
| 2022 | -64.99% |
| 2021 | -48.71% |
| 2020 | -74.27% |
| 2019 | 280.72% |
Continue Researching NOVN
Want to do more research on Novan Inc's stock and its price? Try the links below:Novan Inc (NOVN) Stock Price | Nasdaq
Novan Inc (NOVN) Stock Quote, History and News - Yahoo Finance
Novan Inc (NOVN) Stock Price and Basic Information | MarketWatch
Loading social stream, please wait...