
Novanta Inc. (NOVT): Price and Financial Metrics
NOVT Price/Volume Stats
| Current price | $185.16 | 52-week high | $187.12 |
| Prev. close | $182.40 | 52-week low | $111.20 |
| Day low | $183.12 | Volume | 137,500 |
| Day high | $187.00 | Avg. volume | 137,500 |
| 50-day MA | $166.34 | Dividend yield | N/A |
| 200-day MA | $159.07 | Market Cap | 6.65B |
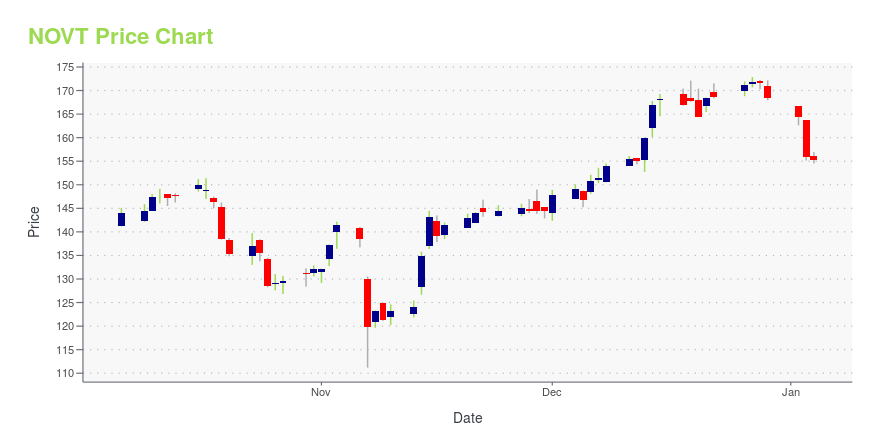
NOVT Stock Price Chart Interactive Chart >
Novanta Inc. (NOVT) Company Bio
Novanta Inc. designs, develops, manufactures, and sells precision photonic and motion control components, and subsystems to original equipment manufacturers in the medical equipment and advanced industrial technology markets. The company operates through three segments: Laser Products, Vision Technologies, and Precision Motion. The company was founded in 1968 and is based in Bedford, Massachusetts.
Latest NOVT News From Around the Web
Below are the latest news stories about NOVANTA INC that investors may wish to consider to help them evaluate NOVT as an investment opportunity.
Is the Growth Rate of Novanta (NOVT) Going to Pick Up Again?Wasatch Global Investors, an investment management firm, released its “Wasatch U.S. Select Fund” third quarter 2023 investor letter. A copy of the same can be downloaded here. Concerns about the impact of rising interest rates and the possibility of a recession caused stocks to decline in the third quarter. In this context, the fund’s Investor […] |
Novanta Inc CFO Robert Buckley Sells 6,000 SharesOn December 19, 2023, Robert Buckley, the CFO of Novanta Inc (NASDAQ:NOVT), sold 6,000 shares of the company's stock, according to a recent SEC Filing. |
14 Best Automation Stocks To Buy NowIn this article, we discuss the 14 best automation stocks to buy now. If you want to skip our detailed analysis of these stocks, go directly to 5 Best Automation Stocks To Buy Now. Automation is a trend that has been sweeping across the business world for the past few decades, making headlines every now […] |
Novanta to Present at the CJS Securities 24th Annual New Ideas for the New Year Investor Conference on Wednesday, January 10, 2024BEDFORD, Mass., December 13, 2023--Novanta Inc. (Nasdaq: NOVT) (the "Company"), a trusted technology partner to medical and advanced technology equipment manufacturers, announced today that Robert Buckley, Chief Financial Officer, Chuck Ravetto, Group President, and Ray Nash, Vice President, Corporate Finance, are scheduled to present at the CJS Securities 24th Annual New Ideas for the New Year Investor Conference on Wednesday, January 10, 2024, which is being held virtually. |
Novanta to Present at the J.P. Morgan 42nd Annual Healthcare Conference on Wednesday, January 10, 2024BEDFORD, Mass., December 11, 2023--Novanta Inc. (Nasdaq: NOVT) (the "Company"), a trusted technology partner to medical and advanced technology equipment manufacturers, announced today that Matthijs Glastra, Chair & Chief Executive Officer, and Robert Buckley, Chief Financial Officer, are scheduled to present at the J.P. Morgan 42nd Annual Healthcare Conference on Wednesday, January 10, 2024, in San Francisco, California. |
NOVT Price Returns
| 1-mo | 13.34% |
| 3-mo | 16.15% |
| 6-mo | 14.12% |
| 1-year | 5.07% |
| 3-year | 35.96% |
| 5-year | 109.81% |
| YTD | 9.95% |
| 2023 | 23.95% |
| 2022 | -22.95% |
| 2021 | 49.15% |
| 2020 | 33.67% |
| 2019 | 40.38% |
Continue Researching NOVT
Want to see what other sources are saying about Novanta Inc's financials and stock price? Try the links below:Novanta Inc (NOVT) Stock Price | Nasdaq
Novanta Inc (NOVT) Stock Quote, History and News - Yahoo Finance
Novanta Inc (NOVT) Stock Price and Basic Information | MarketWatch
Loading social stream, please wait...