ServiceNow Inc. (NOW): Price and Financial Metrics
NOW Price/Volume Stats
Current price | $699.08 | 52-week high | $701.11 |
Prev. close | $687.68 | 52-week low | $353.62 |
Day low | $688.56 | Volume | 1,083,800 |
Day high | $701.11 | Avg. volume | 1,396,939 |
50-day MA | $608.59 | Dividend yield | N/A |
200-day MA | $540.56 | Market Cap | 143.31B |
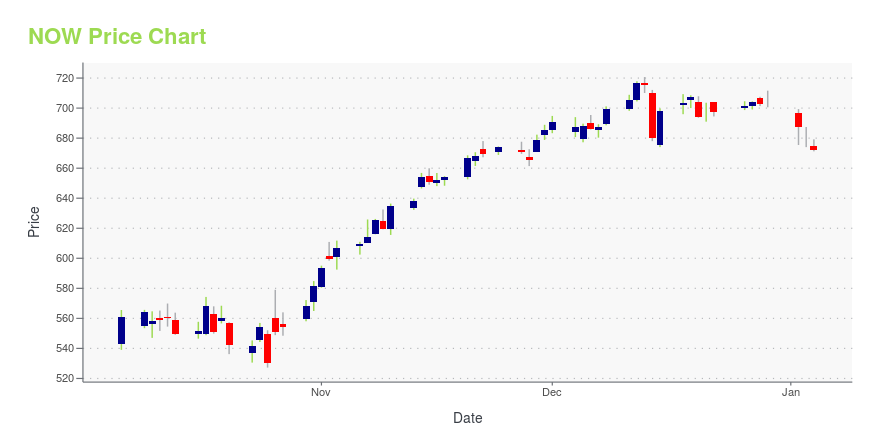
NOW Stock Price Chart Interactive Chart >
NOW POWR Grades
- Growth is the dimension where NOW ranks best; there it ranks ahead of 95.8% of US stocks.
- The strongest trend for NOW is in Quality, which has been heading down over the past 177 days.
- NOW ranks lowest in Value; there it ranks in the 12th percentile.
NOW Stock Summary
- With a market capitalization of $141,611,950,000, SERVICENOW INC has a greater market value than 98.61% of US stocks.
- NOW's price/sales ratio is 16.71; that's higher than the P/S ratio of 93.6% of US stocks.
- Over the past twelve months, NOW has reported earnings growth of 209.45%, putting it ahead of 94.04% of US stocks in our set.
- If you're looking for stocks that are quantitatively similar to SERVICENOW INC, a group of peers worth examining would be INTU, ISRG, RTX, IBM, and UBER.
- Visit NOW's SEC page to see the company's official filings. To visit the company's web site, go to www.servicenow.com.
NOW Valuation Summary
- NOW's EV/EBIT ratio is 161.6; this is 678.8% higher than that of the median Technology stock.
- Over the past 139 months, NOW's price/sales ratio has gone down 3.6.
Below are key valuation metrics over time for NOW.
Stock | Date | P/S | P/B | P/E | EV/EBIT |
---|---|---|---|---|---|
NOW | 2023-11-28 | 16.1 | 19.0 | 86.0 | 161.6 |
NOW | 2023-11-27 | 16.2 | 19.1 | 86.7 | 162.9 |
NOW | 2023-11-24 | 16.3 | 19.2 | 87.1 | 163.7 |
NOW | 2023-11-22 | 16.2 | 19.1 | 86.6 | 162.7 |
NOW | 2023-11-21 | 16.2 | 19.1 | 86.4 | 162.4 |
NOW | 2023-11-20 | 16.1 | 19.0 | 86.2 | 162.0 |
NOW Growth Metrics
- Its 4 year net cashflow from operations growth rate is now at 408.71%.
- The 3 year net income to common stockholders growth rate now stands at 673.69%.
- Its 5 year price growth rate is now at 258.46%.

The table below shows NOW's growth in key financial areas (numbers in millions of US dollars).
Date | Revenue | Operating Cash Flow | Net Income to Common Stock |
---|---|---|---|
2022-12-31 | 7,245 | 2,723 | 325 |
2022-09-30 | 6,919 | 2,405 | 201 |
2022-06-30 | 6,600 | 2,460 | 184 |
2022-03-31 | 6,257 | 2,327 | 223 |
2021-12-31 | 5,896 | 2,191 | 230 |
2021-09-30 | 5,531.33 | 2,032.525 | 220.648 |
NOW's Quality Factors
The “Quality” component of the POWR Ratings focuses on 31 different factors of a companies fundamentals and operational strength. Here are some key insights as we drill into the specifics of these quality attributes.- NOW has a Quality Grade of B, ranking ahead of 86.6% of graded US stocks.
- NOW's asset turnover comes in at 0.611 -- ranking 265th of 563 Business Services stocks.
- EPAY, CTG, and SSTK are the stocks whose asset turnover ratios are most correlated with NOW.
The table below shows NOW's key quality metrics over time.
Period | Asset Turnover | Gross Margin | ROIC |
---|---|---|---|
2021-09-30 | 0.611 | 0.773 | 0.051 |
2021-06-30 | 0.601 | 0.776 | 0.043 |
2021-03-31 | 0.609 | 0.780 | 0.049 |
2020-12-31 | 0.620 | 0.782 | 0.042 |
2020-09-30 | 0.638 | 0.782 | 0.051 |
2020-06-30 | 0.673 | 0.780 | 0.072 |
NOW Price Target
For more insight on analysts targets of NOW, see our NOW price target page. And for a list of of all stocks sorted by upside potential based on analyst target price, see our Top Price Target page.
Average Price Target | $662.64 | Average Broker Recommendation | 1.35 (Strong Buy) |
ServiceNow Inc. (NOW) Company Bio
ServiceNow (Service-now in 2011) is an American software company based in Santa Clara, California that develops a cloud computing platform to help companies manage digital workflows for enterprise operations. Founded in 2004 by Fred Luddy, ServiceNow is listed on the New York Stock Exchange and is a constituent of the Russell 1000 Index and S&P 500 Index. In 2018, Forbes magazine named it number one on its list of the world's most innovative companies. (Source:Wikipedia)
Latest NOW News From Around the Web
Below are the latest news stories about SERVICENOW INC that investors may wish to consider to help them evaluate NOW as an investment opportunity.
3 No-Brainer Stocks You Must Own in 2024According to ING Economics, the Federal Reserve's interest rate hike cycle has not only come to an end but the central bank is expected to cut interest rates multiple times in 2024. This bodes well for the U.S. stock market. Investors keen to take advantage of the improving stock market sentiment can consider buying high-quality stocks riding strong tailwinds. |
Is ServiceNow (NOW) Outperforming Other Computer and Technology Stocks This Year?Here is how ServiceNow (NOW) and SentinelOne (S) have performed compared to their sector so far this year. |
ServiceNow Named a Leader in Governance, Risk, and Compliance by Independent Research FirmSANTA CLARA, Calif., December 08, 2023--ServiceNow (NYSE: NOW), the leading digital workflow company making the world work better for everyone, has been named a Leader in the Forrester Wave™: Governance, Risk, and Compliance, Q4 2023. This rating recognizes the ServiceNow Integrated Risk Management platform for Governance, Risk, and Compliance (GRC). |
Approach ServiceNow With CautionIn this daily bar chart of NOW, below, I can see that prices have climbed higher the past year. The trading volume does not show me an expanding pattern but the On-Balance-Volume (OBV) line does show us a positive trend. The Moving Average Convergence Divergence (MACD) oscillator is above the zero line but it is crossing lower suggesting a potential shift in the trend. |
Chase Coleman Stock Portfolio: 10 Top Stock PicksIn this article, we discuss Chase Coleman and his top 10 stock picks. If you want to read about some more stocks in the Coleman portfolio, go directly to Chase Coleman Stock Portfolio: 5 Top Stock Picks. Many hedge fund managers on Wall Street owe their success to Julian Robertson, the billionaire chief of Tiger […] |
NOW Price Returns
1-mo | 12.80% |
3-mo | 16.50% |
6-mo | 27.95% |
1-year | 77.62% |
3-year | 32.40% |
5-year | 278.09% |
YTD | 80.05% |
2022 | -40.18% |
2021 | 17.93% |
2020 | 94.97% |
2019 | 58.56% |
2018 | 36.55% |
Continue Researching NOW
Want to see what other sources are saying about ServiceNow Inc's financials and stock price? Try the links below:ServiceNow Inc (NOW) Stock Price | Nasdaq
ServiceNow Inc (NOW) Stock Quote, History and News - Yahoo Finance
ServiceNow Inc (NOW) Stock Price and Basic Information | MarketWatch
Loading social stream, please wait...