EnPro Industries Inc (NPO): Price and Financial Metrics
GET POWR RATINGS... FREE!
NPO POWR Grades
- NPO scores best on the Sentiment dimension, with a Sentiment rank ahead of 93.43% of US stocks.
- The strongest trend for NPO is in Growth, which has been heading down over the past 179 days.
- NPO ranks lowest in Growth; there it ranks in the 35th percentile.
NPO Stock Summary
- Of note is the ratio of Enpro Industries Inc's sales and general administrative expense to its total operating expenses; 81.81% of US stocks have a lower such ratio.
- With a year-over-year growth in debt of 129.17%, Enpro Industries Inc's debt growth rate surpasses 91.9% of about US stocks.
- Enpro Industries Inc's shareholder yield -- a measure of how much capital is returned to stockholders via dividends and buybacks -- is -29.69%, greater than the shareholder yield of only 13.42% of stocks in our set.
- If you're looking for stocks that are quantitatively similar to Enpro Industries Inc, a group of peers worth examining would be PRA, APG, FRME, TILE, and AVNT.
- Visit NPO's SEC page to see the company's official filings. To visit the company's web site, go to www.enproindustries.com.
NPO Valuation Summary
- In comparison to the median Industrials stock, NPO's EV/EBIT ratio is 222.2% higher, now standing at 70.4.
- NPO's EV/EBIT ratio has moved up 67 over the prior 235 months.
- Over the past 235 months, NPO's price/sales ratio has gone up 1.3.
Below are key valuation metrics over time for NPO.
Stock | Date | P/S | P/B | P/E | EV/EBIT |
---|---|---|---|---|---|
NPO | 2021-09-03 | 1.6 | 1.6 | 90.8 | 70.4 |
NPO | 2021-09-02 | 1.6 | 1.6 | 90.9 | 70.5 |
NPO | 2021-09-01 | 1.6 | 1.6 | 90.5 | 70.2 |
NPO | 2021-08-31 | 1.6 | 1.6 | 90.3 | 70.1 |
NPO | 2021-08-30 | 1.6 | 1.6 | 91.8 | 71.1 |
NPO | 2021-08-27 | 1.6 | 1.6 | 92.2 | 71.3 |
NPO Growth Metrics
- The 3 year price growth rate now stands at 37.91%.
- The 2 year price growth rate now stands at -36.72%.
- Its year over year revenue growth rate is now at -5.1%.

The table below shows NPO's growth in key financial areas (numbers in millions of US dollars).
Date | Revenue | Operating Cash Flow | Net Income to Common Stock |
---|---|---|---|
2021-12-31 | 1,141.8 | 142 | 177.2 |
2021-09-30 | 1,137 | 107 | 66.7 |
2021-06-30 | 1,122.2 | 82.7 | 19.5 |
2021-03-31 | 1,070.6 | 77.6 | -16.3 |
2020-12-31 | 1,074 | 51.4 | 184.4 |
2020-09-30 | 883.4 | 99.1 | 195.3 |
NPO's Quality Factors
The “Quality” component of the POWR Ratings focuses on 31 different factors of a companies fundamentals and operational strength. Here are some key insights as we drill into the specifics of these quality attributes.- NPO has a Quality Grade of C, ranking ahead of 64.16% of graded US stocks.
- NPO's asset turnover comes in at 0.54 -- ranking 18th of 22 Rubber and Plastic Products stocks.
- WMS, BERY, and ATR are the stocks whose asset turnover ratios are most correlated with NPO.
The table below shows NPO's key quality metrics over time.
Period | Asset Turnover | Gross Margin | ROIC |
---|---|---|---|
2021-06-30 | 0.540 | 0.378 | 0.029 |
2021-03-31 | 0.519 | 0.364 | -0.007 |
2020-12-31 | 0.524 | 0.350 | 0.210 |
2020-09-30 | 0.433 | 0.366 | 0.191 |
2020-06-30 | 0.482 | 0.348 | 0.198 |
2020-03-31 | 0.573 | 0.342 | 0.224 |
NPO Price Target
For more insight on analysts targets of NPO, see our NPO price target page. And for a list of of all stocks sorted by upside potential based on analyst target price, see our Top Price Target page.
Average Price Target | $106.33 | Average Broker Recommendation | 1.17 (Strong Buy) |
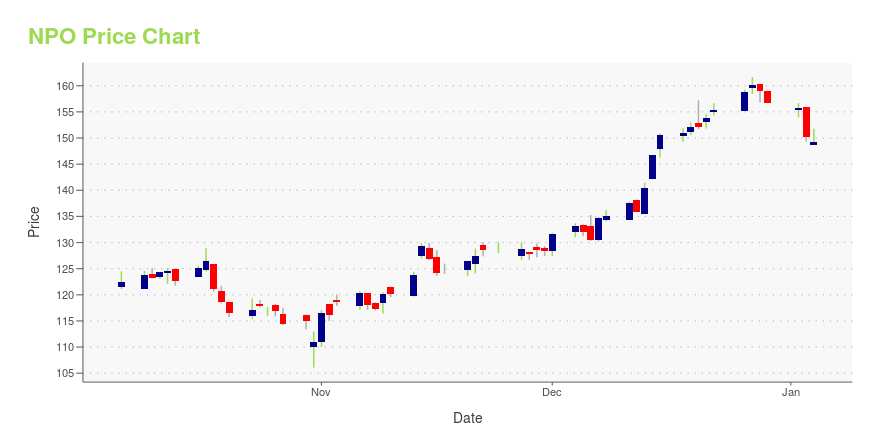
NPO Stock Price Chart Interactive Chart >
NPO Price/Volume Stats
Current price | $94.00 | 52-week high | $117.63 |
Prev. close | $91.91 | 52-week low | $79.80 |
Day low | $92.06 | Volume | 63,500 |
Day high | $95.25 | Avg. volume | 105,815 |
50-day MA | $97.47 | Dividend yield | 1.22% |
200-day MA | $98.48 | Market Cap | 1.96B |
EnPro Industries Inc (NPO) Company Bio
EnPro Industries is a leader in sealing products, metal polymer and filament wound bearings, components and service for reciprocating compressors, diesel and dual-fuel engines and other engineered products for use in critical applications by industries worldwide. The company was founded in 2002 and is based in Charlotte, North Carolina.
Latest NPO News From Around the Web
Below are the latest news stories about Enpro Industries Inc that investors may wish to consider to help them evaluate NPO as an investment opportunity.
EnPro Industries (NPO) Q4 2021 Earnings Call TranscriptWith me today is Eric Vaillancourt, our president and chief executive officer; and Milt Childress, executive vice president and chief financial officer. Before we begin today's discussion, a friendly reminder that we will be making forward-looking statements on this call that are not historical facts and that are considered forward-looking in nature. |
EnPro Industries, Inc. (NPO) CEO Eric Vaillancourt on Q4 2021 Results - Earnings Call TranscriptEnPro Industries, Inc. (NPO) Q4 2021 Earnings Conference Call February 22, 2022 08:30 AM ET Company Participants James Gentile - Vice President-Investor Relations Eric Vaillancourt - President & Chief Executive Officer Milt Childress - Executive Vice President & Chief Financial Officer Conference Call Participants Steve Ferazani - Sidoti Jeff Hammond... |
EnPro Reports Fourth Quarter and Full Year 2021 Results, Introduces 2022 GuidanceCHARLOTTE, N.C., February 22, 2022--EnPro Industries, Inc. (NYSE: NPO) today announced its financial results for the fourth quarter and full year 2021 and introduced 2022 guidance. |
EnPro (NPO) Announces 4% Hike in Quarterly Dividend RateEnPro (NPO) board hikes the quarterly dividend rate by 4%. The move is in sync with the company's shareholder-friendly policies. |
Enpro to Present at Gabelli’s 32nd Annual Pump, Valve & Water Systems SymposiumCHARLOTTE, N.C., February 17, 2022--Enpro to present at Gabelli’s 32nd Annual Pump, Valve & Water Systems Symposium on Thurs Feb 24. The company’s presentation is scheduled for 11am ET. |
NPO Price Returns
1-mo | -4.67% |
3-mo | -15.90% |
6-mo | -15.06% |
1-year | 3.76% |
3-year | 65.28% |
5-year | 51.48% |
YTD | -14.38% |
2021 | 47.48% |
2020 | 15.05% |
2019 | 13.05% |
2018 | -34.87% |
2017 | 40.54% |
NPO Dividends
Ex-Dividend Date | Type | Payout Amount | Change | ||||||
---|---|---|---|---|---|---|---|---|---|
Loading, please wait... |
Continue Researching NPO
Want to see what other sources are saying about Enpro Industries Inc's financials and stock price? Try the links below:Enpro Industries Inc (NPO) Stock Price | Nasdaq
Enpro Industries Inc (NPO) Stock Quote, History and News - Yahoo Finance
Enpro Industries Inc (NPO) Stock Price and Basic Information | MarketWatch
Loading social stream, please wait...