
NerdWallet, Inc. (NRDS): Price and Financial Metrics
NRDS Price/Volume Stats
| Current price | $16.05 | 52-week high | $17.30 |
| Prev. close | $15.92 | 52-week low | $6.38 |
| Day low | $15.88 | Volume | 290,124 |
| Day high | $16.21 | Avg. volume | 319,219 |
| 50-day MA | $14.27 | Dividend yield | N/A |
| 200-day MA | $13.69 | Market Cap | 1.25B |
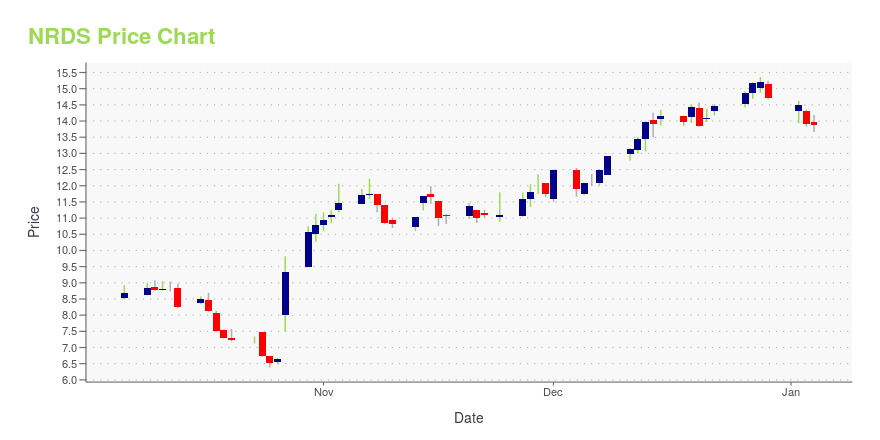
NRDS Stock Price Chart Interactive Chart >
NerdWallet, Inc. (NRDS) Company Bio
NerdWallet, Inc. operates a digital platform that provides consumer-driven advice about personal finance by connecting individuals and small and mid-sized businesses with financial products providers. The company's platform offers value across various financial products, including credit cards, mortgages, insurance, SMB products, personal loans, banking, investing, and student loans. It serves customers in the United States, the United Kingdom, and Canada. The company was founded in 2009 and is based in San Francisco, California.
Latest NRDS News From Around the Web
Below are the latest news stories about NERDWALLET INC that investors may wish to consider to help them evaluate NRDS as an investment opportunity.
Optimistic Investors Push NerdWallet, Inc. (NASDAQ:NRDS) Shares Up 28% But Growth Is LackingNerdWallet, Inc. ( NASDAQ:NRDS ) shares have continued their recent momentum with a 28% gain in the last month alone... |
NerdWallet, Inc. (NASDAQ:NRDS) insiders seem bullish, own 46% and have been buying more recentlyKey Insights Significant insider control over NerdWallet implies vested interests in company growth The top 3... |
These 5 Companies Were Huge Winners This Earnings Season. Can the Good Times Keep Rolling?One of these five stocks is trading at a low price and has a profit catalyst that's greater than anything on the horizon for the other four. |
Why NerdWallet Stock Bucked the Market Drop Last Month With a 21% GainShares of financial information company NerdWallet (NASDAQ: NRDS) jumped 21.3% in October, according to data provided by S&P Global Market Intelligence. Ironically, Wall Street didn't appear overly impressed with the Q3 results from NerdWallet. Oppenheimer analyst Jed Kelly subsequently lowered his price target for NerdWallet stock from $16 per share to $13 per share, according to StreetInsider. |
AI Predicts These 7 Stocks Will Double Your Investment in 2024AI predicted that these stocks will double your investment in 2024, I mostly agree with its predictions |
NRDS Price Returns
| 1-mo | 11.15% |
| 3-mo | 24.52% |
| 6-mo | -0.25% |
| 1-year | 49.86% |
| 3-year | N/A |
| 5-year | N/A |
| YTD | 9.04% |
| 2023 | 53.33% |
| 2022 | -38.26% |
| 2021 | N/A |
| 2020 | N/A |
| 2019 | N/A |
Loading social stream, please wait...