National Storage Affiliates Trust Common Shares of Beneficial Interest (NSA): Price and Financial Metrics
GET POWR RATINGS... FREE!
NSA POWR Grades
- NSA scores best on the Growth dimension, with a Growth rank ahead of 92.96% of US stocks.
- The strongest trend for NSA is in Momentum, which has been heading up over the past 179 days.
- NSA's current lowest rank is in the Value metric (where it is better than 14.8% of US stocks).
NSA Stock Summary
- NSA's current price/earnings ratio is 63.75, which is higher than 88.67% of US stocks with positive earnings.
- Of note is the ratio of National Storage Affiliates Trust's sales and general administrative expense to its total operating expenses; merely 10.23% of US stocks have a lower such ratio.
- The ratio of debt to operating expenses for National Storage Affiliates Trust is higher than it is for about 94.19% of US stocks.
- Stocks that are quantitatively similar to NSA, based on their financial statements, market capitalization, and price volatility, are RRR, ESRT, LAZY, QSR, and EZPW.
- NSA's SEC filings can be seen here. And to visit National Storage Affiliates Trust's official web site, go to www.nationalstorageaffiliates.com.
NSA Valuation Summary
- NSA's price/sales ratio is 10.7; this is 64.62% higher than that of the median Real Estate stock.
- NSA's EV/EBIT ratio has moved up 11.9 over the prior 77 months.
- Over the past 77 months, NSA's EV/EBIT ratio has gone up 11.9.
Below are key valuation metrics over time for NSA.
Stock | Date | P/S | P/B | P/E | EV/EBIT |
---|---|---|---|---|---|
NSA | 2021-09-02 | 10.7 | 4.4 | 76.2 | 48.7 |
NSA | 2021-09-01 | 10.6 | 4.4 | 75.3 | 48.3 |
NSA | 2021-08-31 | 10.5 | 4.3 | 74.6 | 48.0 |
NSA | 2021-08-30 | 10.5 | 4.3 | 74.5 | 47.9 |
NSA | 2021-08-27 | 10.4 | 4.3 | 73.8 | 47.6 |
NSA | 2021-08-26 | 10.2 | 4.3 | 73.0 | 47.2 |
NSA Growth Metrics
- Its year over year net income to common stockholders growth rate is now at 604.31%.
- Its 3 year cash and equivalents growth rate is now at 70.71%.
- Its 3 year revenue growth rate is now at 137.46%.

The table below shows NSA's growth in key financial areas (numbers in millions of US dollars).
Date | Revenue | Operating Cash Flow | Net Income to Common Stock |
---|---|---|---|
2021-12-31 | 585.671 | 331.349 | 92.149 |
2021-09-30 | 526.19 | 291.66 | 84.73 |
2021-06-30 | 484.821 | 259.23 | 67.994 |
2021-03-31 | 450.992 | 234.039 | 49.7 |
2020-12-31 | 432.222 | 220.654 | 35.512 |
2020-09-30 | 418.681 | 214.215 | 30.55 |
NSA's Quality Factors
The “Quality” component of the POWR Ratings focuses on 31 different factors of a companies fundamentals and operational strength. Here are some key insights as we drill into the specifics of these quality attributes.- NSA has a Quality Grade of C, ranking ahead of 38.09% of graded US stocks.
- NSA's asset turnover comes in at 0.135 -- ranking 136th of 444 Trading stocks.
- DHIL, AVB, and JHG are the stocks whose asset turnover ratios are most correlated with NSA.
The table below shows NSA's key quality metrics over time.
Period | Asset Turnover | Gross Margin | ROIC |
---|---|---|---|
2021-06-30 | 0.135 | 0.724 | 0.027 |
2021-03-31 | 0.131 | 0.717 | 0.024 |
2020-12-31 | 0.129 | 0.714 | 0.022 |
2020-09-30 | 0.130 | 0.713 | 0.022 |
2020-06-30 | 0.129 | 0.714 | 0.017 |
2020-03-31 | 0.128 | 0.715 | 0.013 |
NSA Price Target
For more insight on analysts targets of NSA, see our NSA price target page. And for a list of of all stocks sorted by upside potential based on analyst target price, see our Top Price Target page.
Average Price Target | $58.30 | Average Broker Recommendation | 1.62 (Moderate Buy) |
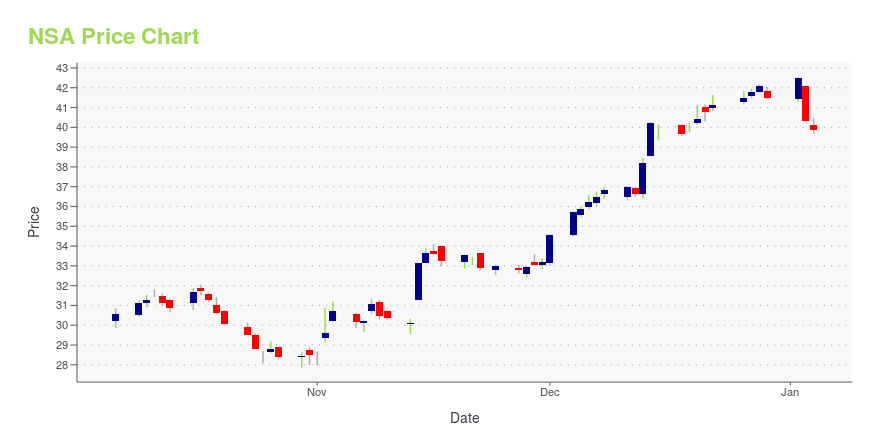
NSA Stock Price Chart Interactive Chart >
NSA Price/Volume Stats
Current price | $49.57 | 52-week high | $70.04 |
Prev. close | $50.22 | 52-week low | $45.13 |
Day low | $49.54 | Volume | 15,858 |
Day high | $50.23 | Avg. volume | 791,909 |
50-day MA | $52.23 | Dividend yield | 4.38% |
200-day MA | $59.06 | Market Cap | 4.54B |
National Storage Affiliates Trust Common Shares of Beneficial Interest (NSA) Company Bio
National Storage Affiliates is focused on the ownership, operation and acquisition of self storage properties located within the top 100 metropolitan statistical areas throughout the United States. The company was founded in 2014 and is based in Greenwood Village, Colorado.
Latest NSA News From Around the Web
Below are the latest news stories about National Storage Affiliates Trust that investors may wish to consider to help them evaluate NSA as an investment opportunity.
National Storage Affiliates raises quarterly dividend by 11% to $0.50National Storage Affiliates (NYSE:NSA) declares $0.50/share quarterly dividend, 11.1% increase from prior dividend of $0.45. Forward yield 3.5% Payable March 31; for shareholders of record March 15; ex-div March 14. See NSA Dividend Scorecard, Yield Chart, & Dividend Growth.... |
National Storage Affiliates Trust Announces Largest Increase in Quarterly Common Dividend Since IPOGREENWOOD VILLAGE, Colo., February 24, 2022--National Storage Affiliates Trust Announces Largest Increase in Quarterly Common Dividend Since IPO |
National Storage Affiliates Trust (NSA) CEO Tamara Fischer on Q4 2021 Results - Earnings Call TranscriptNational Storage Affiliates Trust (NSA) Q4 2021 Earnings Conference Call February 22, 2022 01:00 PM ET Company Participants George Hoglund - IR Tamara Fischer - CEO Dave Cramer - COO Brandon Togashi - CFO Conference Call Participants Elvis Rodriguez - Bank of America Securities Neil Malkin - Capital One Todd... |
National Storage Affiliates Trust Reports Fourth Quarter and Full Year 2021 ResultsGREENWOOD VILLAGE, Colo.--(BUSINESS WIRE)--National Storage Affiliates Trust Reports Fourth Quarter and Full Year 2021 Results |
National Storage Affiliates sees 2022 core FFO above consensus; shares gainNational Storage Affiliates (NSA) is anticipating an above-consensus core FFO in 2022 following better-than-expected Q4 results. Shares of NSA rise 1.1% in premarket trading. On the |
NSA Price Returns
1-mo | -4.36% |
3-mo | -22.08% |
6-mo | -26.90% |
1-year | 1.46% |
3-year | 94.09% |
5-year | 161.19% |
YTD | -26.90% |
2021 | 98.04% |
2020 | 11.67% |
2019 | 32.41% |
2018 | 1.21% |
2017 | 29.01% |
NSA Dividends
Ex-Dividend Date | Type | Payout Amount | Change | ||||||
---|---|---|---|---|---|---|---|---|---|
Loading, please wait... |
Continue Researching NSA
Want to do more research on National Storage Affiliates Trust's stock and its price? Try the links below:National Storage Affiliates Trust (NSA) Stock Price | Nasdaq
National Storage Affiliates Trust (NSA) Stock Quote, History and News - Yahoo Finance
National Storage Affiliates Trust (NSA) Stock Price and Basic Information | MarketWatch
Loading social stream, please wait...