
Norfolk Southern Corp. (NSC): Price and Financial Metrics
NSC Price/Volume Stats
| Current price | $247.22 | 52-week high | $263.66 |
| Prev. close | $222.90 | 52-week low | $183.09 |
| Day low | $240.60 | Volume | 2,993,455 |
| Day high | $249.93 | Avg. volume | 1,314,289 |
| 50-day MA | $223.25 | Dividend yield | 2.41% |
| 200-day MA | $230.02 | Market Cap | 55.85B |
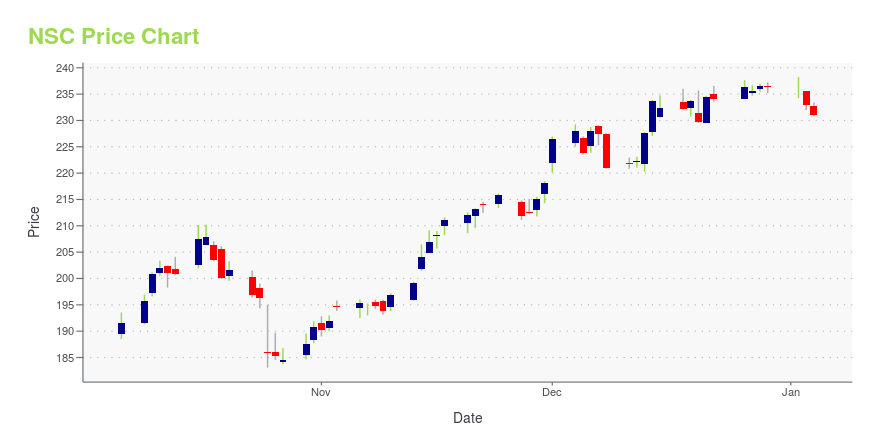
NSC Stock Price Chart Interactive Chart >
Norfolk Southern Corp. (NSC) Company Bio
The Norfolk Southern Railway (reporting mark NS) is a Class I freight railroad in the United States. With headquarters in Atlanta, Georgia, the company operates 19,420 route miles (31,250 km) in 22 eastern states, the District of Columbia, and has rights in Canada over the Albany to Montréal route of the Canadian Pacific Railway, and previously on CN from Buffalo to St. Thomas. NS is responsible for maintaining 28,400 miles (45,700 km), with the remainder being operated under trackage rights from other parties responsible for maintenance. The most common commodity hauled on the railway is coal from mines in Indiana, Kentucky, Pennsylvania, Tennessee, Virginia, and West Virginia. The railway also offers the largest intermodal network in eastern North America. (Source:Wikipedia)
Latest NSC News From Around the Web
Below are the latest news stories about NORFOLK SOUTHERN CORP that investors may wish to consider to help them evaluate NSC as an investment opportunity.
Estimating The Intrinsic Value Of Norfolk Southern Corporation (NYSE:NSC)Key Insights Norfolk Southern's estimated fair value is US$274 based on 2 Stage Free Cash Flow to Equity With US$234... |
Norfolk Southern grants $5 million to promote safety, build communitiesNorfolk Southern Corporation (NYSE: NSC) has distributed nearly $5 million in local grants to 330 organizations across its 22-state network as part of its Safety First and Thriving Communities grant programs. |
Norfolk Southern (NSC) to Provide Rail Service to GeorgiaNorfolk Southern (NSC) will link the blue ridge connector inland terminal to Georgia Ports Authority's mason mega rail terminal in Savannah. |
Norfolk Southern announces 2023 Thoroughbred Sustainability Partner AwardsNorfolk Southern Corporation (NYSE: NSC) announced Thursday the recipients of its annual Thoroughbred Sustainability Partner Awards. The awards recognize Norfolk Southern partner companies who are leaders in the categories of Energy Efficiency, Innovation, and Environmental Stewardship. |
Norfolk Southern grants nearly $600,000 to 29 organizations combatting homelessnessNorfolk Southern Corporation (NYSE: NSC) will donate nearly $600,000 in grants to 29 organizations that serve homeless individuals across its 22-state network. Recipient organizations are based in communities served by Norfolk Southern and provide an array of vital services to homeless populations, from housing to job assistance to food and mental health support. |
NSC Price Returns
| 1-mo | 16.34% |
| 3-mo | 3.64% |
| 6-mo | 6.77% |
| 1-year | 7.67% |
| 3-year | 0.28% |
| 5-year | 43.99% |
| YTD | 5.81% |
| 2023 | -1.63% |
| 2022 | -15.59% |
| 2021 | 27.26% |
| 2020 | 24.76% |
| 2019 | 32.39% |
NSC Dividends
| Ex-Dividend Date | Type | Payout Amount | Change | ||||||
|---|---|---|---|---|---|---|---|---|---|
| Loading, please wait... | |||||||||
Continue Researching NSC
Want to do more research on Norfolk Southern Corp's stock and its price? Try the links below:Norfolk Southern Corp (NSC) Stock Price | Nasdaq
Norfolk Southern Corp (NSC) Stock Quote, History and News - Yahoo Finance
Norfolk Southern Corp (NSC) Stock Price and Basic Information | MarketWatch
Loading social stream, please wait...