Insight Enterprises, Inc. (NSIT): Price and Financial Metrics
GET POWR RATINGS... FREE!
NSIT POWR Grades
- Momentum is the dimension where NSIT ranks best; there it ranks ahead of 94.1% of US stocks.
- The strongest trend for NSIT is in Growth, which has been heading down over the past 179 days.
- NSIT's current lowest rank is in the Sentiment metric (where it is better than 38.51% of US stocks).
NSIT Stock Summary
- The capital turnover (annual revenue relative to shareholder's equity) for NSIT is 6.47 -- better than 93.85% of US stocks.
- The price/operating cash flow metric for INSIGHT ENTERPRISES INC is higher than 91.11% of stocks in our set with a positive cash flow.
- With a price/sales ratio of 0.37, INSIGHT ENTERPRISES INC has a higher such ratio than only 11.07% of stocks in our set.
- Stocks that are quantitatively similar to NSIT, based on their financial statements, market capitalization, and price volatility, are TSRI, AVT, PDCO, IESC, and MAN.
- Visit NSIT's SEC page to see the company's official filings. To visit the company's web site, go to www.insight.com.
NSIT Valuation Summary
- In comparison to the median Technology stock, NSIT's EV/EBIT ratio is 41.92% lower, now standing at 11.5.
- Over the past 243 months, NSIT's price/sales ratio has gone up 0.3.
Below are key valuation metrics over time for NSIT.
Stock | Date | P/S | P/B | P/E | EV/EBIT |
---|---|---|---|---|---|
NSIT | 2023-01-27 | 0.4 | 2.4 | 14.7 | 11.5 |
NSIT | 2023-01-26 | 0.4 | 2.4 | 14.7 | 11.5 |
NSIT | 2023-01-25 | 0.4 | 2.4 | 14.7 | 11.5 |
NSIT | 2023-01-24 | 0.4 | 2.4 | 14.6 | 11.5 |
NSIT | 2023-01-23 | 0.4 | 2.4 | 14.6 | 11.5 |
NSIT | 2023-01-20 | 0.4 | 2.4 | 14.5 | 11.4 |
NSIT Growth Metrics
- The year over year net income to common stockholders growth rate now stands at 28.02%.
- Its 2 year net cashflow from operations growth rate is now at -264.73%.
- Its year over year cash and equivalents growth rate is now at -17.29%.

The table below shows NSIT's growth in key financial areas (numbers in millions of US dollars).
Date | Revenue | Operating Cash Flow | Net Income to Common Stock |
---|---|---|---|
2022-09-30 | 10,494.6 | 75.614 | 265.264 |
2022-06-30 | 10,407.77 | -283.473 | 263.431 |
2022-03-31 | 9,893.895 | -163.234 | 232.808 |
2021-12-31 | 9,436.113 | 163.711 | 219.345 |
2021-09-30 | 9,161.405 | -224.3 | 210.6 |
2021-06-30 | 8,650.362 | -136.76 | 194.023 |
NSIT's Quality Factors
The “Quality” component of the POWR Ratings focuses on 31 different factors of a companies fundamentals and operational strength. Here are some key insights as we drill into the specifics of these quality attributes.- NSIT has a Quality Grade of C, ranking ahead of 59.79% of graded US stocks.
- NSIT's asset turnover comes in at 2.028 -- ranking 47th of 165 Retail stocks.
- TJX, ROST, and LL are the stocks whose asset turnover ratios are most correlated with NSIT.
The table below shows NSIT's key quality metrics over time.
Period | Asset Turnover | Gross Margin | ROIC |
---|---|---|---|
2021-06-30 | 2.028 | 0.156 | 0.177 |
2021-03-31 | 2.005 | 0.156 | 0.178 |
2020-12-31 | 2.017 | 0.156 | 0.159 |
2020-09-30 | 2.035 | 0.155 | 0.137 |
2020-06-30 | 2.010 | 0.152 | 0.116 |
2020-03-31 | 2.113 | 0.148 | 0.123 |
NSIT Price Target
For more insight on analysts targets of NSIT, see our NSIT price target page. And for a list of of all stocks sorted by upside potential based on analyst target price, see our Top Price Target page.
Average Price Target | $116.00 | Average Broker Recommendation | 1.25 (Strong Buy) |
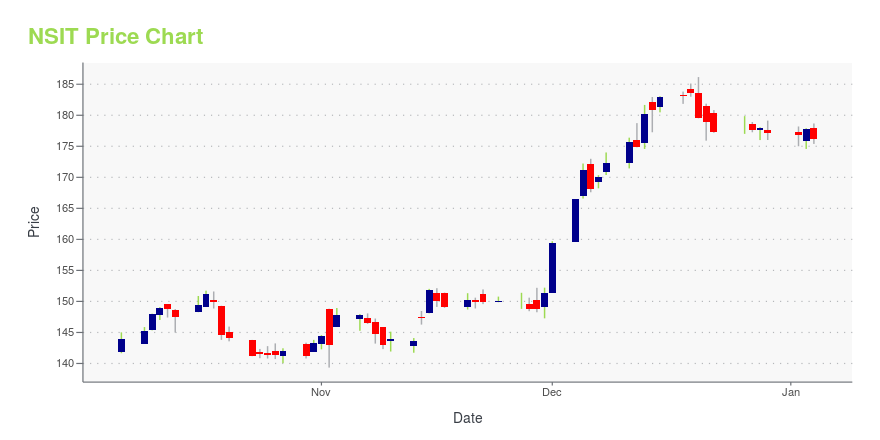
NSIT Stock Price Chart Interactive Chart >
NSIT Price/Volume Stats
Current price | $114.43 | 52-week high | $114.95 |
Prev. close | $113.85 | 52-week low | $81.11 |
Day low | $113.92 | Volume | 4,972 |
Day high | $114.81 | Avg. volume | 179,536 |
50-day MA | $104.27 | Dividend yield | N/A |
200-day MA | $95.28 | Market Cap | 3.99B |
Insight Enterprises, Inc. (NSIT) Company Bio
Insight Enterprises, Inc. is a global provider of information technology, services, and cloud solutions to worldwide enterprises, governments, schools, and healthcare organizations. It helps businesses define, architect, implement, and manage Intelligent Technology Solutions in North America, Europe, the Middle East, Africa, and Asia-Pacific. The company offers solutions such as supply chain optimization, connected workforce, cloud and data center transformation, and digital innovation.
Latest NSIT News From Around the Web
Below are the latest news stories about INSIGHT ENTERPRISES INC that investors may wish to consider to help them evaluate NSIT as an investment opportunity.
Estimating The Intrinsic Value Of Insight Enterprises, Inc. (NASDAQ:NSIT)How far off is Insight Enterprises, Inc. ( NASDAQ:NSIT ) from its intrinsic value? Using the most recent financial... |
Are Robust Financials Driving The Recent Rally In Insight Enterprises, Inc.'s (NASDAQ:NSIT) Stock?Most readers would already be aware that Insight Enterprises' (NASDAQ:NSIT) stock increased significantly by 17% over... |
D&H Distributing Wins 3 Major Honors Nationally, in the Channel, & in its Community— The Distributor Has Been Named a Forbes Top-100 Private Company, a Best Place to Work, and a Major National Integrator’s Partner of the Year — HARRISBURG, Pa., Dec. 13, 2022 (GLOBE NEWSWIRE) -- D&H Distributing, a major provider of SMB, mid-market, and consumer technologies to the North American channel, announced it has earned three prestigious accolades this fall: one in its local community, one in the IT solution provider supply channel that it serves, and one on the national level. D&H rec |
Insight Recognized as One of World’s Top Female-Friendly CompaniesCHANDLER, Ariz., December 12, 2022--Insight Enterprises (NASDAQ:NSIT), a Fortune 500 solutions integrator helping organizations accelerate their digital journey, has been recognized by Forbes magazine as one of the 2022 World’s Top Female-Friendly Companies, ranking No. 112 out of the top 400 companies overall and No. 8 in the IT services industry. |
Despite Fast-paced Momentum, Insight Enterprises (NSIT) Is Still a Bargain StockInsight Enterprises (NSIT) made it through our 'Fast-Paced Momentum at a Bargain' screen and could be a great choice for investors looking for stocks that have gained strong momentum recently but are still trading at reasonable prices. |
NSIT Price Returns
1-mo | 11.97% |
3-mo | 21.49% |
6-mo | 23.69% |
1-year | 21.58% |
3-year | 72.93% |
5-year | 213.16% |
YTD | 14.12% |
2022 | -5.94% |
2021 | 40.10% |
2020 | 8.25% |
2019 | 72.49% |
2018 | 6.42% |
Continue Researching NSIT
Want to do more research on Insight Enterprises Inc's stock and its price? Try the links below:Insight Enterprises Inc (NSIT) Stock Price | Nasdaq
Insight Enterprises Inc (NSIT) Stock Quote, History and News - Yahoo Finance
Insight Enterprises Inc (NSIT) Stock Price and Basic Information | MarketWatch
Loading social stream, please wait...