
Insperity, Inc. (NSP): Price and Financial Metrics
NSP Price/Volume Stats
| Current price | $101.85 | 52-week high | $122.98 |
| Prev. close | $100.53 | 52-week low | $85.04 |
| Day low | $100.16 | Volume | 195,915 |
| Day high | $102.00 | Avg. volume | 282,961 |
| 50-day MA | $95.99 | Dividend yield | 2.39% |
| 200-day MA | $104.50 | Market Cap | 3.84B |
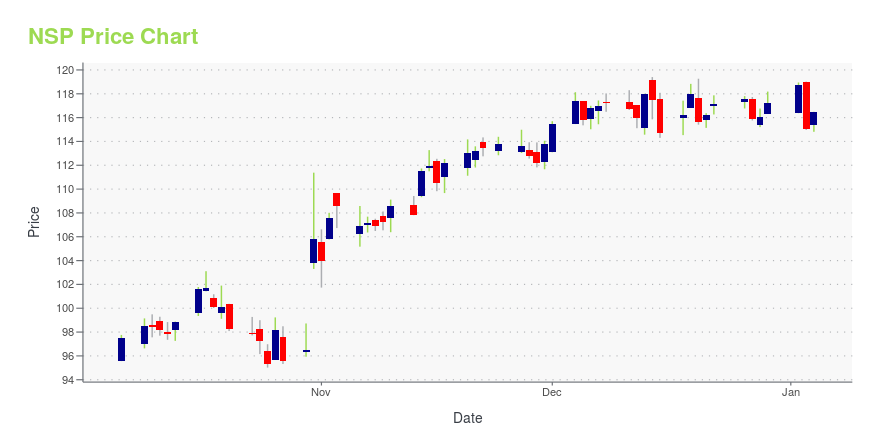
NSP Stock Price Chart Interactive Chart >
Insperity, Inc. (NSP) Company Bio
Insperity Inc. provides an array of human resources and business solutions to enhance business performance for small and medium-sized businesses in the United States. The company was founded in 1986 and is based in Kingwood, Texas.
Latest NSP News From Around the Web
Below are the latest news stories about INSPERITY INC that investors may wish to consider to help them evaluate NSP as an investment opportunity.
Here's Why We Think Insperity (NYSE:NSP) Might Deserve Your Attention TodayThe excitement of investing in a company that can reverse its fortunes is a big draw for some speculators, so even... |
Here's Why Insperity (NSP) Deserves to be Retained Right NowShareholder-friendly attitude bodes well for Insperity (NSP), while competition in the industry is concerning. |
Insperity Inc's Dividend AnalysisInsperity Inc (NYSE:NSP) recently announced a dividend of $0.57 per share, payable on 2023-12-18, with the ex-dividend date set for 2023-12-01. As investors look forward to this upcoming payment, the spotlight also shines on the company's dividend history, yield, and growth rates. Using the data from GuruFocus, let's look into Insperity Inc's dividend performance and assess its sustainability. |
Insperity, Inc. (NSP) Up 7.9% Since Last Earnings Report: Can It Continue?Insperity, Inc. (NSP) reported earnings 30 days ago. What's next for the stock? We take a look at earnings estimates for some clues. |
Insperity Declares Quarterly Dividend of $0.57HOUSTON, November 16, 2023--Insperity, Inc. (NYSE: NSP), a leading provider of human resources and business performance solutions for America’s best businesses, today announced that its board of directors has declared a quarterly cash dividend of $0.57 per share. The cash dividend will be paid on December 18, 2023 to all stockholders of record as of December 4, 2023. |
NSP Price Returns
| 1-mo | 11.40% |
| 3-mo | -1.62% |
| 6-mo | -10.05% |
| 1-year | -13.40% |
| 3-year | 15.25% |
| 5-year | -20.84% |
| YTD | -12.04% |
| 2023 | 5.24% |
| 2022 | -1.91% |
| 2021 | 50.15% |
| 2020 | -3.06% |
| 2019 | -6.75% |
NSP Dividends
| Ex-Dividend Date | Type | Payout Amount | Change | ||||||
|---|---|---|---|---|---|---|---|---|---|
| Loading, please wait... | |||||||||
Continue Researching NSP
Here are a few links from around the web to help you further your research on Insperity Inc's stock as an investment opportunity:Insperity Inc (NSP) Stock Price | Nasdaq
Insperity Inc (NSP) Stock Quote, History and News - Yahoo Finance
Insperity Inc (NSP) Stock Price and Basic Information | MarketWatch
Loading social stream, please wait...