NetScout Systems, Inc. (NTCT): Price and Financial Metrics

NetScout Systems, Inc. (NTCT): $30.73

-0.26 (-0.84%)

POWR Rating

Component Grades

Momentum

C

Stability

C

Sentiment

Quality

B

Add NTCT to Watchlist
Sign Up

Industry: Technology - Services

Industry

C

Ranked

#1 of 82

in industry

NTCT Price/Volume Stats

Current price $30.73 52-week high $38.02
Prev. close $30.99 52-week low $25.90
Day low $30.57 Volume 255,312
Day high $31.34 Avg. volume 420,214
50-day MA $28.85 Dividend yield N/A
200-day MA $31.57 Market Cap 2.19B

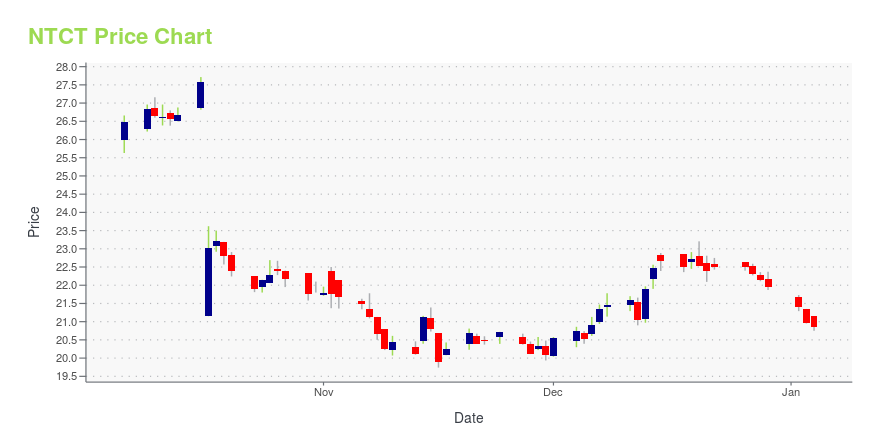
NTCT Stock Price Chart Interactive Chart >

NTCT POWR Grades

  • Growth is the dimension where NTCT ranks best; there it ranks ahead of 99.67% of US stocks.
  • NTCT's strongest trending metric is Growth; it's been moving up over the last 179 days.
  • NTCT ranks lowest in Momentum; there it ranks in the 38th percentile.

NTCT Stock Summary

  • With a price/earnings ratio of 36.52, NETSCOUT SYSTEMS INC P/E ratio is greater than that of about 82.04% of stocks in our set with positive earnings.
  • With a year-over-year growth in debt of -61.36%, NETSCOUT SYSTEMS INC's debt growth rate surpasses just 4.09% of about US stocks.
  • Shareholder yield, a measure of how much is returned to shareholders via dividends and share repurchases, for NTCT comes in at 18.37% -- higher than that of 90.01% of stocks in our set.
  • Stocks with similar financial metrics, market capitalization, and price volatility to NETSCOUT SYSTEMS INC are IPGP, DIOD, PRGS, PCTI, and HRMY.
  • Visit NTCT's SEC page to see the company's official filings. To visit the company's web site, go to www.netscout.com.

NTCT Valuation Summary

  • NTCT's price/earnings ratio is 37.4; this is 40.34% higher than that of the median Technology stock.
  • Over the past 243 months, NTCT's price/sales ratio has gone up 1.

Below are key valuation metrics over time for NTCT.

Stock Date P/S P/B P/E EV/EBIT
NTCT 2023-05-22 2.4 1.1 37.4 25.5
NTCT 2023-05-19 2.4 1.1 37.2 25.3
NTCT 2023-05-18 2.4 1.1 36.8 25.0
NTCT 2023-05-17 2.3 1.1 36.0 24.4
NTCT 2023-05-16 2.3 1.0 35.2 23.8
NTCT 2023-05-15 2.3 1.0 38.6 29.3

NTCT Growth Metrics

    Its 3 year cash and equivalents growth rate is now at 55.3%.
  • Its 2 year cash and equivalents growth rate is now at 87.94%.
  • The 3 year price growth rate now stands at 39.76%.
NTCT's revenue has moved down $264,484,000 over the prior 70 months.

The table below shows NTCT's growth in key financial areas (numbers in millions of US dollars).

Date Revenue Operating Cash Flow Net Income to Common Stock
2022-12-31 897.628 199.549 54.463
2022-09-30 890.278 246.285 49.57
2022-06-30 874.115 259.436 40.083
2022-03-31 855.575 296.013 35.874
2021-12-31 877.773 232.405 55.717
2021-09-30 844.318 204.614 37.013

NTCT's Quality Factors

The “Quality” component of the POWR Ratings focuses on 31 different factors of a companies fundamentals and operational strength. Here are some key insights as we drill into the specifics of these quality attributes.
  • NTCT has a Quality Grade of B, ranking ahead of 76.32% of graded US stocks.
  • NTCT's asset turnover comes in at 0.275 -- ranking 74th of 83 Computers stocks.
  • CSPI, CERN, and PSTG are the stocks whose asset turnover ratios are most correlated with NTCT.

The table below shows NTCT's key quality metrics over time.

Period Asset Turnover Gross Margin ROIC
2021-09-30 0.275 0.744 0.109
2021-06-30 0.272 0.733 0.081
2021-03-31 0.269 0.733 0.065
2020-12-31 0.273 0.729 0.055
2020-09-30 0.284 0.727 0.063
2020-06-30 0.287 0.730 0.047

NTCT Price Target

For more insight on analysts targets of NTCT, see our NTCT price target page. And for a list of of all stocks sorted by upside potential based on analyst target price, see our Top Price Target page.

Average Price Target $29.88 Average Broker Recommendation 1.88 (Hold)

NetScout Systems, Inc. (NTCT) Company Bio


NetScout Systems designs, develops, manufactures, markets, licenses, sells, and supports network, application, and service assurance solutions in the United States, Europe, Asia, and internationally. It offers performance analytics and operational intelligence solutions that facilitate the evolution toward new computing paradigms, such as virtualization, mobility, and cloud. The company was founded in 1984 and is based in Westford, Massachusetts.


NTCT Latest News Stream


Event/Time News Detail
Loading, please wait...

NTCT Latest Social Stream


Loading social stream, please wait...

View Full NTCT Social Stream

Latest NTCT News From Around the Web

Below are the latest news stories about NETSCOUT SYSTEMS INC that investors may wish to consider to help them evaluate NTCT as an investment opportunity.

Zacks Industry Outlook Highlights Extreme Networks, NetScout and NETGEAR

Extreme Networks, NetScout and NETGEAR have been highlighted in this Industry Outlook article.

Yahoo | May 22, 2023

3 Networking Stocks to Watch for From a Thriving Industry

The Zacks Computer - Networking industry players like EXTR, NTCT and NTGR are poised to benefit from the accelerated 5G deployment and the increasing demand for network security solutions.

Yahoo | May 19, 2023

NETSCOUT Announces Participation in Upcoming Investor Event

WESTFORD, Mass., May 11, 2023--NETSCOUT SYSTEMS, INC. (NASDAQ: NTCT), a leading provider of performance management, cybersecurity, and DDoS protection solutions, announced today that the Company plans to participate in the following upcoming investor event:

Yahoo | May 11, 2023

Here's Why NetScout Systems (NASDAQ:NTCT) Has Caught The Eye Of Investors

It's common for many investors, especially those who are inexperienced, to buy shares in companies with a good story...

Yahoo | May 5, 2023

NetScout Systems (NTCT) Q4 Earnings and Revenues Surpass Estimates

NetScout (NTCT) delivered earnings and revenue surprises of 35.71% and 2.06%, respectively, for the quarter ended March 2023. Do the numbers hold clues to what lies ahead for the stock?

Yahoo | May 4, 2023

Read More 'NTCT' Stories Here

NTCT Price Returns

1-mo 12.94%
3-mo 9.36%
6-mo -18.92%
1-year N/A
3-year 11.87%
5-year 13.81%
YTD -5.48%
2022 -1.72%
2021 20.64%
2020 13.92%
2019 1.86%
2018 -22.40%

Get Free Updates

Join thousands of investors who get the latest news, insights and top rated picks from StockNews.com!