
NETGEAR, Inc. (NTGR): Price and Financial Metrics
NTGR Price/Volume Stats
| Current price | $16.00 | 52-week high | $16.33 |
| Prev. close | $15.60 | 52-week low | $10.40 |
| Day low | $15.64 | Volume | 144,049 |
| Day high | $16.02 | Avg. volume | 230,366 |
| 50-day MA | $14.42 | Dividend yield | N/A |
| 200-day MA | $14.00 | Market Cap | 465.60M |
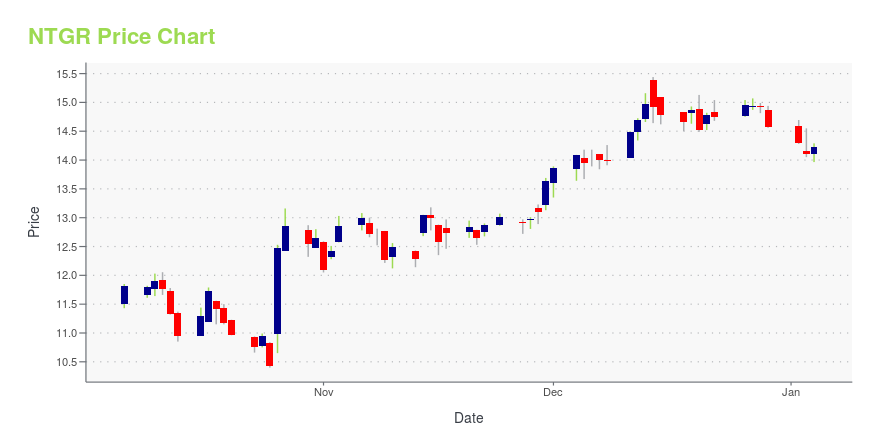
NTGR Stock Price Chart Interactive Chart >
NETGEAR, Inc. (NTGR) Company Bio
Netgear offers devices, such as network attached storage, Internet protocol security cameras and home automation devices and services. The company was founded in 1996 and is based in San Jose, California.
Latest NTGR News From Around the Web
Below are the latest news stories about NETGEAR INC that investors may wish to consider to help them evaluate NTGR as an investment opportunity.
Woodward (WWD) Appears Primed for Uptrend With 40.6% YTD GainWoodward's (WWD) performance gains from steady demand trends in the Aerospace and Industrial segments. Weak Defense OEM sales owing to lower guided weapons sales remain a concern. |
4 Top Tech Stocks to Buy and 3 to Stay Far Away FromTech stocks are on the move. |
NETGEAR (NTGR) Launches Smart Switches to Improve ConnectivityNETGEAR (NTGR) unveils the S3600 Series Smart Switches to meet the rising bandwidth demand for applications and devices. |
NETGEAR Introduces Top-of-the-line Cloud Manageable Smart Switch Series Designed for 10 Gig ConnectivitySAN JOSE, Calif., December 12, 2023--NETGEAR®, Inc. (NASDAQ: NTGR), the leading provider of networking products that power businesses both large and small, today launched the cloud-managed NETGEAR S3600 Series Smart Switches, joining the company’s cutting-edge portfolio of switches designed to meet the growing demands for faster networking that today’s businesses require. The S3600 Series includes the 8-Port 10G/Multi-Gigabit (XS508TM) and 16-Port 10G/Multi-Gigabit (XS516TM) that provide flexibl |
NETGEAR to Host 2023 Virtual Financial Analyst DaySAN JOSE, Calif., November 29, 2023--NETGEAR, Inc., (NASDAQ: NTGR), a global networking company that delivers innovative networking and Internet connected products to consumers and businesses, will host a virtual financial analyst day on Thursday, December 7, 2023. The Company’s executive team will present their vision for NETGEAR at the event. |
NTGR Price Returns
| 1-mo | 7.74% |
| 3-mo | 7.74% |
| 6-mo | 8.11% |
| 1-year | 14.78% |
| 3-year | -51.07% |
| 5-year | -53.28% |
| YTD | 9.74% |
| 2023 | -19.49% |
| 2022 | -38.00% |
| 2021 | -28.11% |
| 2020 | 65.77% |
| 2019 | -6.73% |
Continue Researching NTGR
Want to see what other sources are saying about Netgear Inc's financials and stock price? Try the links below:Netgear Inc (NTGR) Stock Price | Nasdaq
Netgear Inc (NTGR) Stock Quote, History and News - Yahoo Finance
Netgear Inc (NTGR) Stock Price and Basic Information | MarketWatch
Loading social stream, please wait...