
Nutrien Ltd. (NTR): Price and Financial Metrics
NTR Price/Volume Stats
| Current price | $51.22 | 52-week high | $69.12 |
| Prev. close | $50.75 | 52-week low | $47.86 |
| Day low | $50.58 | Volume | 1,484,700 |
| Day high | $51.53 | Avg. volume | 1,885,025 |
| 50-day MA | $53.30 | Dividend yield | 4.36% |
| 200-day MA | $53.94 | Market Cap | 25.34B |
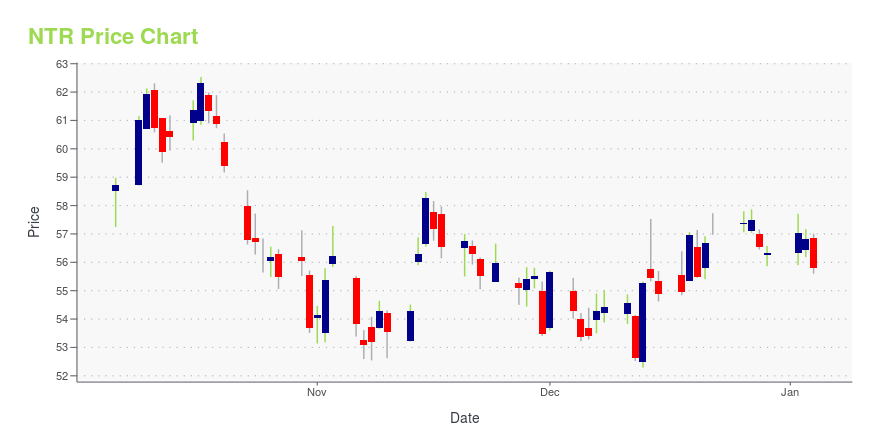
NTR Stock Price Chart Interactive Chart >
Nutrien Ltd. (NTR) Company Bio
Nutrien is a Canadian fertilizer company based in Saskatoon, Saskatchewan. It is the largest producer of potash and the third largest producer of nitrogen fertilizer in the world. It has over 2,000 retail locations across North America, South America, and Australia with more than 23,500 employees. It is listed on the Toronto Stock Exchange (symbol NTR) and New York Stock Exchange (symbol NTR), with a market capitalization of $34 billion as of January 2018. It was formed through the merger of PotashCorp and Agrium, in a transaction that closed on January 1, 2018. (Source:Wikipedia)
Latest NTR News From Around the Web
Below are the latest news stories about NUTRIEN LTD that investors may wish to consider to help them evaluate NTR as an investment opportunity.
Nutrien Ltd's Dividend AnalysisNutrien Ltd (NYSE:NTR) recently announced a dividend of $0.53 per share, payable on 2024-01-12, with the ex-dividend date set for 2023-12-28. As investors look forward to this upcoming payment, the spotlight also shines on the company's dividend history, yield, and growth rates. Using the data from GuruFocus, let's look into Nutrien Ltd's dividend performance and assess its sustainability. |
16 Most Promising Dividend Stocks According to AnalystsIn this article, we discuss 16 most promising dividend stocks according to analysts. You can skip our detailed analysis of dividend stocks and their performance over the years, and go directly to read 5 Most Promising Dividend Stocks According to Analysts. This year brought a notable shift in the investment scene, where technology stocks surged […] |
Nutrien Ltd. (TSE:NTR) is a favorite amongst institutional investors who own 70%Key Insights Given the large stake in the stock by institutions, Nutrien's stock price might be vulnerable to their... |
7 Low-Volatility Stocks for Stable Growth in 2024Wager on these stocks to buy for stable growth, handpicked for their low volatility and potential to weather economic headwinds. |
CORRECTED-Brazilian farmers slow fertilizer buys as drought dampens corn-planting plansBrazil's drought is causing farmers there to delay fertilizer purchases for their upcoming corn-planting season, denting sales for global fertilizer suppliers in the world's top corn-exporting country, executives told Reuters. Brazil's soybean harvest is already delayed and that hold-up may push back planting for the main corn season that follows it early next year, which is likely to affect fertilizer companies like Nutrien, Mosaic and Yara. Corn is one of the most fertilizer-intensive crops. |
NTR Price Returns
| 1-mo | 0.30% |
| 3-mo | -0.46% |
| 6-mo | 4.98% |
| 1-year | -18.44% |
| 3-year | -0.37% |
| 5-year | 23.04% |
| YTD | -5.21% |
| 2023 | -19.46% |
| 2022 | -0.09% |
| 2021 | 59.08% |
| 2020 | 5.60% |
| 2019 | 5.57% |
NTR Dividends
| Ex-Dividend Date | Type | Payout Amount | Change | ||||||
|---|---|---|---|---|---|---|---|---|---|
| Loading, please wait... | |||||||||
Loading social stream, please wait...