Natera, Inc. (NTRA): Price and Financial Metrics
GET POWR RATINGS... FREE!
NTRA POWR Grades
- Growth is the dimension where NTRA ranks best; there it ranks ahead of 56.49% of US stocks.
- The strongest trend for NTRA is in Momentum, which has been heading down over the past 177 days.
- NTRA's current lowest rank is in the Momentum metric (where it is better than 1.11% of US stocks).
NTRA Stock Summary
- The capital turnover (annual revenue relative to shareholder's equity) for NTRA is 2.15 -- better than 75.12% of US stocks.
- NTRA's price/sales ratio is 5.85; that's higher than the P/S ratio of 79.02% of US stocks.
- As for revenue growth, note that NTRA's revenue has grown 37.39% over the past 12 months; that beats the revenue growth of 77.76% of US companies in our set.
- Stocks that are quantitatively similar to NTRA, based on their financial statements, market capitalization, and price volatility, are ASTC, LNSR, BNGO, VMEO, and OCX.
- Visit NTRA's SEC page to see the company's official filings. To visit the company's web site, go to www.natera.com.
NTRA Valuation Summary
- In comparison to the median Healthcare stock, NTRA's EV/EBIT ratio is 181.77% lower, now standing at -8.3.
- NTRA's price/earnings ratio has moved up 206.2 over the prior 92 months.
Below are key valuation metrics over time for NTRA.
Stock | Date | P/S | P/B | P/E | EV/EBIT |
---|---|---|---|---|---|
NTRA | 2023-01-30 | 5.3 | 11.3 | -7.5 | -8.3 |
NTRA | 2023-01-27 | 5.5 | 11.8 | -7.8 | -8.6 |
NTRA | 2023-01-26 | 5.4 | 11.5 | -7.6 | -8.4 |
NTRA | 2023-01-25 | 5.3 | 11.3 | -7.5 | -8.3 |
NTRA | 2023-01-24 | 5.4 | 11.6 | -7.7 | -8.5 |
NTRA | 2023-01-23 | 5.4 | 11.7 | -7.7 | -8.5 |
NTRA Growth Metrics
- Its 2 year cash and equivalents growth rate is now at 113.65%.
- The 4 year net cashflow from operations growth rate now stands at 9.71%.
- Its year over year revenue growth rate is now at 48.52%.

The table below shows NTRA's growth in key financial areas (numbers in millions of US dollars).
Date | Revenue | Operating Cash Flow | Net Income to Common Stock |
---|---|---|---|
2022-09-30 | 775.998 | -449.11 | -545.79 |
2022-06-30 | 723.477 | -437.923 | -575.583 |
2022-03-31 | 667.303 | -397.637 | -546.458 |
2021-12-31 | 625.486 | -335.236 | -471.716 |
2021-09-30 | 564.836 | -309.802 | -407.564 |
2021-06-30 | 504.863 | -251.871 | -314.614 |
NTRA's Quality Factors
The “Quality” component of the POWR Ratings focuses on 31 different factors of a companies fundamentals and operational strength. Here are some key insights as we drill into the specifics of these quality attributes.- NTRA has a Quality Grade of D, ranking ahead of 16.91% of graded US stocks.
- NTRA's asset turnover comes in at 0.553 -- ranking 46th of 81 Healthcare stocks.
- CHE, USPH, and VCYT are the stocks whose asset turnover ratios are most correlated with NTRA.
The table below shows NTRA's key quality metrics over time.
Period | Asset Turnover | Gross Margin | ROIC |
---|---|---|---|
2021-06-30 | 0.553 | 0.496 | -0.316 |
2021-03-31 | 0.510 | 0.498 | -0.272 |
2020-12-31 | 0.490 | 0.479 | -0.286 |
2020-09-30 | 0.509 | 0.480 | -0.277 |
2020-06-30 | 0.609 | 0.472 | -0.279 |
2020-03-31 | 0.692 | 0.462 | -0.273 |
NTRA Price Target
For more insight on analysts targets of NTRA, see our NTRA price target page. And for a list of of all stocks sorted by upside potential based on analyst target price, see our Top Price Target page.
Average Price Target | $150.11 | Average Broker Recommendation | 1.35 (Strong Buy) |
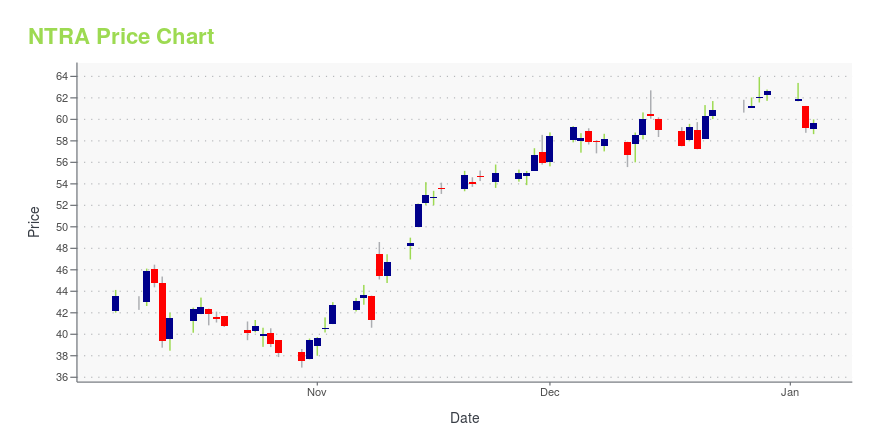
NTRA Stock Price Chart Interactive Chart >
NTRA Price/Volume Stats
Current price | $44.79 | 52-week high | $74.82 |
Prev. close | $46.55 | 52-week low | $26.10 |
Day low | $44.49 | Volume | 663,400 |
Day high | $46.21 | Avg. volume | 1,395,656 |
50-day MA | $40.44 | Dividend yield | N/A |
200-day MA | $41.96 | Market Cap | 4.37B |
Natera, Inc. (NTRA) Company Bio
Natera Inc. is a genetic testing company that develops and commercializes non-invasive methods for analyzing DNA. The company was founded in 2003 and is based in San Carlos, California.
Latest NTRA News From Around the Web
Below are the latest news stories about NATERA INC that investors may wish to consider to help them evaluate NTRA as an investment opportunity.
New Paper Highlights Clinical Utility of Natera’s Renasight™ Test in the Management of Kidney DiseaseAUSTIN, Texas, February 02, 2023--Natera, Inc. (NASDAQ: NTRA), a global leader in cell-free DNA testing, today announced the publication of a new paper in Pediatric Nephrology, which highlights the clinical utility of Renasight™ in aiding the diagnosis and management of kidney disease. The publication can be found here. |
Foundation Medicine, Natera Launch Early Access for Clinical Personalized ctDNA Monitoring TestThe personalized and targeted tumor assay, also available for research use in clinical trials, provides a surrogate measure of tumor burden from blood samples. |
Raymond James Sees ‘Multiple Expansion’ to Drive Stock Market Returns — Here Are 2 Stocks to Play That Bullish SentimentIt’s time to take out the crystal ball and try to see what lies ahead for the stock market this year. So far, it’s clear that stocks are rebounding somewhat from the trough of 2022, and one Wall Street expert says there’s more runway for gains. Writing of the 2023 market situation, Larry Adam, chief investment officer from Raymond James, notes that last year was the second consecutive year of multiple compression – but that situation rarely repeats a third time. He’s predicting a multiple expans |
Why Do Investors Buy Stock In Natera Inc. (NTRA)?Natera Inc. (NASDAQ:NTRA) has a beta value of 1.26 and has seen 1.07 million shares traded in the last trading session. The company, currently valued at $4.32B, closed the last trade at $40.91 per share which meant it gained $1.19 on the day or 3.00% during that session. The NTRA stock price is -82.89% off … Why Do Investors Buy Stock In Natera Inc. (NTRA)? Read More » |
Top Gainers in the Markets: Natera, Inc. (NASDAQ:NTRA 2.45%), HDFC Bank Limited (NYSE:HDB 2.46%)There are two main reasons why moving averages are useful in forex trading: moving averages help traders define trend recognize changes in trend. Now well have a look on, SMA50 … The post Top Gainers in the Markets: Natera, Inc. (NASDAQ:NTRA 2.45%), HDFC Bank Limited (NYSE:HDB 2.46%) appeared first on Stocks Equity . |
NTRA Price Returns
1-mo | 21.28% |
3-mo | 4.92% |
6-mo | -11.87% |
1-year | -35.78% |
3-year | 19.98% |
5-year | 394.37% |
YTD | 11.50% |
2022 | -56.99% |
2021 | -6.16% |
2020 | 195.40% |
2019 | 141.33% |
2018 | 55.28% |
Continue Researching NTRA
Here are a few links from around the web to help you further your research on Natera Inc's stock as an investment opportunity:Natera Inc (NTRA) Stock Price | Nasdaq
Natera Inc (NTRA) Stock Quote, History and News - Yahoo Finance
Natera Inc (NTRA) Stock Price and Basic Information | MarketWatch
Loading social stream, please wait...