
Nutriband Inc. (NTRB): Price and Financial Metrics
NTRB Price/Volume Stats
| Current price | $7.56 | 52-week high | $9.60 |
| Prev. close | $8.47 | 52-week low | $1.53 |
| Day low | $7.55 | Volume | 51,641 |
| Day high | $8.67 | Avg. volume | 37,273 |
| 50-day MA | $5.87 | Dividend yield | N/A |
| 200-day MA | $3.58 | Market Cap | 83.43M |
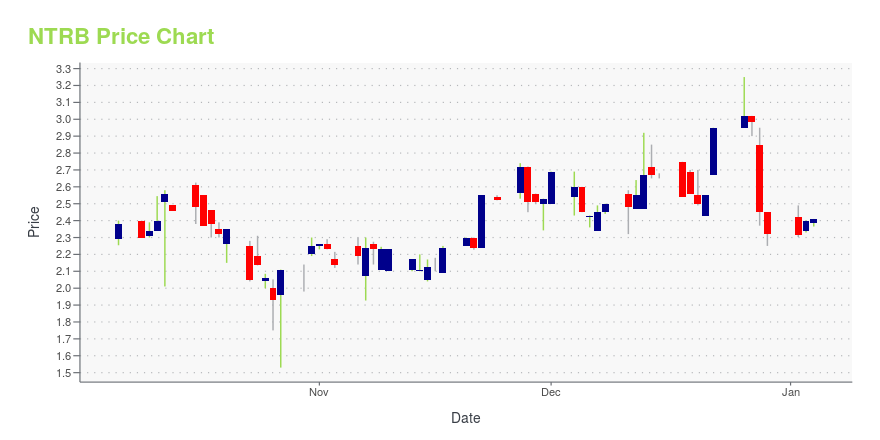
NTRB Stock Price Chart Interactive Chart >
Nutriband Inc. (NTRB) Company Bio
Nutriband Inc. develops a portfolio of transdermal pharmaceutical products. The company's lead product in development is abuse deterrent fentanyl transdermal system that provides clinicians and patients with an extended-release transdermal fentanyl product for use in managing chronic pain. The company has a license agreement with Rambam Med-Tech Ltd. for the development of the RAMBAM Closed System Transfer Devices. Nutriband Inc. was incorporated in 2016 and is headquartered in Orlando, Florida
Latest NTRB News From Around the Web
Below are the latest news stories about NUTRIBAND INC that investors may wish to consider to help them evaluate NTRB as an investment opportunity.
NTRB Stock Earnings: Nutriband Reported Results for Q3 2023Nutriband just reported results for the third quarter of 2023. |
Nutriband Inc. Expands its AI Kinesiology Tape Portfolio with the Launch of AI Tape Heating and CoolingORLANDO, FL / ACCESSWIRE / November 28, 2023 / Nutriband Inc. (NASDAQ:NTRB) (NASDAQ:NTRBW), a developer of transdermal pharmaceutical products, today announced the launch of its new Heating and Cooling Kinesiology Tape as part of its Active Intelligence ... |
Nutriband Inc. Signs Supplier Agreement With KT Tape, the World Leader in Kinesiology TapeORLANDO, FL / ACCESSWIRE / November 8, 2023 / Nutriband Inc. (NASDAQ:NTRB)(NASDAQ:NTRBW), today announced that it has signed a supplier agreement with market leading kinesiology tape company, KT Tape. Nutriband Inc.'s wholly owned contract manufacturing ... |
Nutriband’s Aversa(TM) Buprenoprhine May Reach Peak Annual Sales of $70-130 Million Based on Market Assessment by Leading Healthcare Consulting FirmORLANDO, FL / ACCESSWIRE / October 11, 2023 / Nutriband Inc. (NASDAQ:NTRB)(NASDAQ:NTRBW), a company engaged in the development of transdermal pharmaceutical products, today announced it has completed the market assessment and commercialization strategy ... |
Nutriband Unveils Groundbreaking Innovation in Transdermal MedicationsRevolutionary AVERSA™ Technology Sets New Standard for Opioid Patch Safety |
NTRB Price Returns
| 1-mo | 40.00% |
| 3-mo | 112.96% |
| 6-mo | 185.28% |
| 1-year | 63.28% |
| 3-year | -16.00% |
| 5-year | -80.11% |
| YTD | 225.86% |
| 2023 | -35.64% |
| 2022 | -64.24% |
| 2021 | -32.80% |
| 2020 | N/A |
| 2019 | N/A |
Loading social stream, please wait...