Nu Holdings Ltd. (NU): Price and Financial Metrics

Nu Holdings Ltd. (NU): $7.39

0.26 (+3.65%)

POWR Rating

Component Grades

Momentum

C

Stability

D

Sentiment

Quality

C

Add NU to Watchlist
Sign Up

Industry: Consumer Financial Services

Industry

C

Ranked

#38 of 47

in industry

NU Price/Volume Stats

Current price $7.39 52-week high $7.55
Prev. close $7.13 52-week low $3.26
Day low $7.10 Volume 36,498,400
Day high $7.55 Avg. volume 26,846,293
50-day MA $5.57 Dividend yield N/A
200-day MA $4.77 Market Cap 34.69B

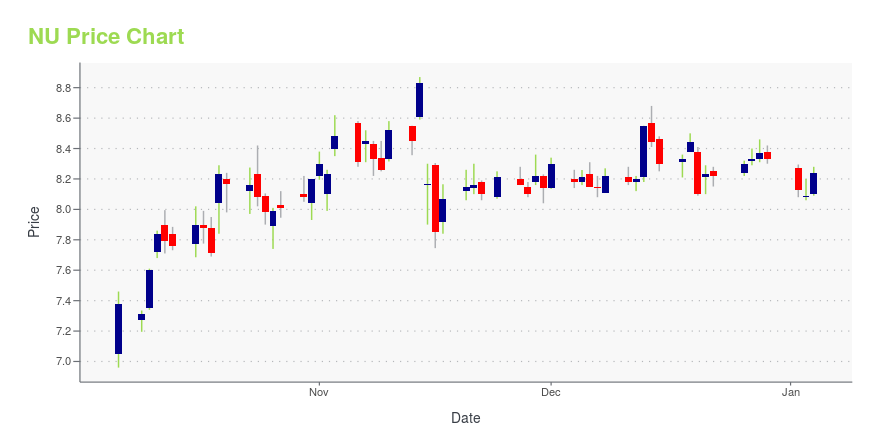
NU Stock Price Chart Interactive Chart >

NU POWR Grades

  • NU scores best on the Growth dimension, with a Growth rank ahead of 91.15% of US stocks.
  • The strongest trend for NU is in Growth, which has been heading down over the past 179 days.
  • NU's current lowest rank is in the Value metric (where it is better than 0.86% of US stocks).

NU Stock Summary

  • NU's one year PEG ratio, measuring expected growth in earnings next year relative to current common stock price is 0.47 -- higher than merely 5.47% of US-listed equities with positive expected earnings growth.
  • NU's went public 1.46 years ago, making it older than merely 1.32% of listed US stocks we're tracking.
  • With a year-over-year growth in debt of 3,363.75%, NU HOLDINGS LTD's debt growth rate surpasses 99.5% of about US stocks.
  • Stocks that are quantitatively similar to NU, based on their financial statements, market capitalization, and price volatility, are EBC, BLDE, APYX, PUMP, and ESSA.
  • To check out NU HOLDINGS LTD's SEC filings, go to the company's page on browse-edgar?action=getcompany&CIK=0001691493.

NU Valuation Summary

  • In comparison to the median Financial Services stock, NU's price/earnings ratio is 2132.94% lower, now standing at -172.8.
  • Over the past 18 months, NU's price/sales ratio has gone down 59.1.

Below are key valuation metrics over time for NU.

Stock Date P/S P/B P/E EV/EBIT
NU 2023-05-19 5.5 5.9 -172.8 10746.5
NU 2023-05-18 5.4 5.8 -169.3 10504.7
NU 2023-05-17 5.3 5.6 -163.8 10114.1
NU 2023-05-16 5.2 5.5 -161.6 9965.3
NU 2023-05-15 5.2 5.5 -161.4 9946.7
NU 2023-05-12 5.7 5.6 -74.8 -75.5

Nu Holdings Ltd. (NU) Company Bio


Nu Holdings Ltd. operates as a digital financial services platform and technology company primarily in Brazil, Mexico, and Colombia. It offers Nu credit and debit cards; Ultraviolet credit and debit cards; and mobile payment solutions for NuAccount customers to make and receive transfers, pay bills, and make everyday purchases through their mobile phones. The company provides savings solutions, such as Nu Personal Accounts, a digital account solution that supports all personal finance activities, from daily purchases and money transfers to savings; and Nu business accounts designed specifically for entrepreneur customers and their businesses. In addition, it offers NuInvest, an investment product that provides equity, fixed-income, options, and ETF products, as well as multimarket funds with curated asset allocations based on the customer's risk profile and financial position; personal unsecured loans; in-app ‘buy now pay later' solution for Nu card customers to pay credit and debit purchases, and banking payment slips over time in up to twelve installments; and NuInsurance protecting solutions to help its customers secure life insurance and funeral benefits. The company was founded in 2013 and is headquartered in Sao Paulo, Brazil.


NU Latest News Stream


Event/Time News Detail
Loading, please wait...

NU Latest Social Stream


Loading social stream, please wait...

View Full NU Social Stream

Latest NU News From Around the Web

Below are the latest news stories about NU HOLDINGS LTD that investors may wish to consider to help them evaluate NU as an investment opportunity.

3 Top Fintech Stocks to Buy in June

The majority of fintech stocks have bounced back this year after a very difficult 2022 when businesses in the space struggled due to rapidly rising interest rates. If you've ever had your credit score run before -- and most U.S. adults have -- then you've interacted, at least indirectly, with Fair Isaac (NYSE: FICO). It's the company that developed the FICO score, which is used widely to judge would-be borrowers' creditworthiness for various types of consumer loans.

Yahoo | June 5, 2023

2 Buffett Stocks to Buy More of in June

When Warren Buffett makes a move, investors closely assess what it could say about the economy and whether or not everyone should follow his lead. For example, Berkshire bought all of its shares of Coca-Cola and American Express, two of its largest holdings, before 1995, and hasn't touched either since. Berkshire Hathaway owns more than 40 stocks, and it's the ones you don't hear about that might be the best stocks to buy.

Yahoo | June 2, 2023

The Best Stocks to Buy With $300 Right Now

The S&P 500 is up 9% this year despite continued economic volatility and a looming recession. The market and the economy don't always move in the same direction, and it looks like investors are ready for some momentum after enduring the S&P 500's longest bear market since 1973. There's no way to know when the bear market will turn into a bull market.

Yahoo | May 24, 2023

Up 85% This Year, Is This Warren Buffett Stock a Buy?

In this video, I will go over Nu Holdings' (NYSE: NU) first-quarter earnings report, which shows why legendary investor Warren Buffett owns this fintech company that has been dominating in South America.

Yahoo | May 22, 2023

Nu Holdings Is Expensive, but Here's Why I Can Live With Its Rich Valuation

After this big rally, there's no beating around the bush: The fintech stock is expensive, trading at more than 42 times forward earnings, with nearly a $31 billion market cap. Nu got its start by offering a credit card with no annual fees through a sleek digital banking experience. While it's hard to imagine Nu keeping up this growth forever, it still hasn't penetrated -- and therefore really monetized -- much of its client base with some of its most profitable products.

Yahoo | May 22, 2023

Read More 'NU' Stories Here

NU Price Returns

1-mo 26.98%
3-mo 64.59%
6-mo 88.04%
1-year 70.67%
3-year N/A
5-year N/A
YTD 81.57%
2022 -56.61%
2021 N/A
2020 N/A
2019 N/A
2018 N/A

Get Free Updates

Join thousands of investors who get the latest news, insights and top rated picks from StockNews.com!