
NeuroMetrix, Inc. (NURO): Price and Financial Metrics
NURO Price/Volume Stats
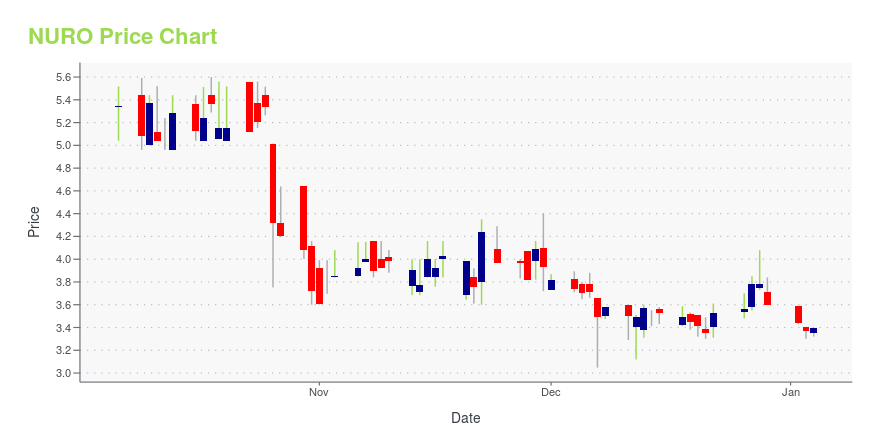
| Current price | $3.70 | 52-week high | $7.84 |
| Prev. close | $3.71 | 52-week low | $2.70 |
| Day low | $3.60 | Volume | 1,134 |
| Day high | $3.70 | Avg. volume | 28,516 |
| 50-day MA | $3.77 | Dividend yield | N/A |
| 200-day MA | $3.83 | Market Cap | 7.44M |
NURO Stock Price Chart Interactive Chart >
NeuroMetrix, Inc. (NURO) Company Bio
NeuroMetrix Inc. is a medical device company that designs, develops and sells proprietary products used to diagnose neuropathies. The Company's neuropathy diagnostic system provides primary care and specialist physicians objective information that aids in the diagnosis of neuropathies at the point of service.
Latest NURO News From Around the Web
Below are the latest news stories about NEUROMETRIX INC that investors may wish to consider to help them evaluate NURO as an investment opportunity.
NeuroMetrix Reports Encouraging Results from Pilot Clinical Trial of Quell® in Post-Acute COVID-19 Syndrome (Long COVID)WOBURN, Mass., Dec. 12, 2023 (GLOBE NEWSWIRE) -- NeuroMetrix, Inc. (Nasdaq: NURO) reported the recent presentation of data from a clinical trial of Quell wearable neuromodulation technology in patients with post-acute COVID-19 syndrome (PACS), commonly called Long COVID. The presentation was made at the National Science Foundation (NSF) funded Center to Stream Healthcare In Place (C2SHIP) annual meeting in Washington DC. The trial was conducted at the Baylor College of Medicine in collaboration |
NeuroMetrix Announces Peer-Reviewed Publication of Phase 2 Clinical Trial Showing that Quell® Improves Painful Symptoms of Chemotherapy Induced Peripheral Neuropathy (CIPN)WOBURN, Mass., Dec. 05, 2023 (GLOBE NEWSWIRE) -- NeuroMetrix, Inc. (Nasdaq: NURO) noted publication of results from a NIH-funded clinical trial of Quell titled "Wireless transcutaneous electric nerve stimulation (TENS) for chronic chemotherapy-induced peripheral neuropathy (CIPN): a proof-of-concept randomized clinical trial." The paper has been electronically published in The Journal of Pain. The study was a phase 2, multi-site, double blinded, randomized, sham-controlled trial. A total of 142 |
NeuroMetrix Announces One-for-Eight Reverse Stock SplitWOBURN, Mass., Nov. 20, 2023 (GLOBE NEWSWIRE) -- NeuroMetrix, Inc. (NASDAQ: NURO) today announced that it will effect a one-for-eight reverse split of its common stock, effective at 5:00 pm on November 21, 2023 (the “Effective Time”). The shares underlying the Company's outstanding options will also be adjusted accordingly. The reverse stock split is intended to increase the per share trading price of the Company's common stock to satisfy the $1.00 minimum bid price requirement for continued lis |
Presenting on the Emerging Growth Conference 64 Day 1 on November 1 Register NowMIAMI, Oct. 31, 2023 (GLOBE NEWSWIRE) -- EmergingGrowth.com a leading independent small cap media portal announces the schedule of the 64th Emerging Growth Conference on November 1st and 2nd, 2023. The Emerging Growth Conference identifies companies in a wide range of growth sectors, with strong management teams, innovative products & services, focused strategy, execution, and the overall potential for long-term growth. Register for the conference here. Submit Questions for any of the presenting |
NeuroMetrix to Present at the Emerging Growth Conference on November 1, 2023WOBURN, Mass., Oct. 30, 2023 (GLOBE NEWSWIRE) -- NeuroMetrix, Inc. (Nasdaq: NURO), announced today that it will present at the Emerging Growth Conference on Wednesday, November 1, 2023. This live, interactive, online event will give shareholders and the investment community the opportunity to interact in real time with the Company’s Chairman and Chief Executive Officer, Dr. Shai N. Gozani. Dr. Gozani will provide a brief update on business highlights and recent developments, including the evolut |
NURO Price Returns
| 1-mo | 0.00% |
| 3-mo | -16.67% |
| 6-mo | 20.52% |
| 1-year | -49.18% |
| 3-year | -97.35% |
| 5-year | -87.43% |
| YTD | 2.78% |
| 2023 | -69.80% |
| 2022 | -70.32% |
| 2021 | 58.86% |
| 2020 | -26.51% |
| 2019 | -43.42% |
Continue Researching NURO
Want to do more research on NeuroMetrix Inc's stock and its price? Try the links below:NeuroMetrix Inc (NURO) Stock Price | Nasdaq
NeuroMetrix Inc (NURO) Stock Quote, History and News - Yahoo Finance
NeuroMetrix Inc (NURO) Stock Price and Basic Information | MarketWatch
Loading social stream, please wait...