
Nuvei Corp. (NVEI): Price and Financial Metrics
NVEI Price/Volume Stats
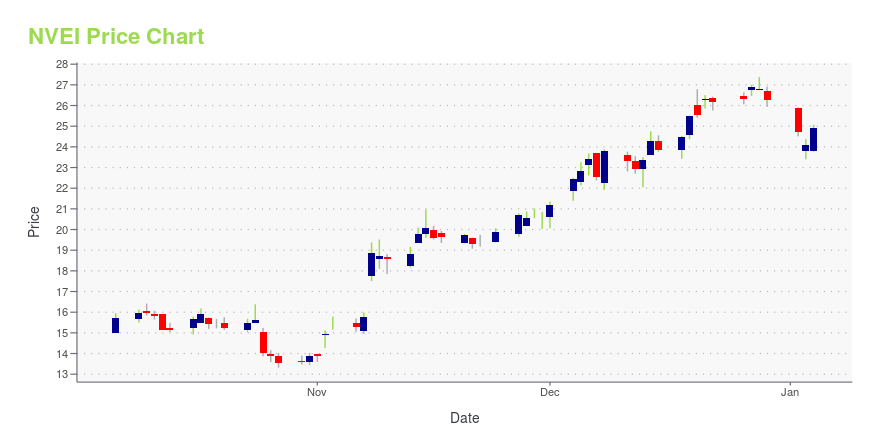
| Current price | $32.91 | 52-week high | $34.67 |
| Prev. close | $32.90 | 52-week low | $13.32 |
| Day low | $32.83 | Volume | 343,899 |
| Day high | $33.00 | Avg. volume | 1,066,450 |
| 50-day MA | $32.34 | Dividend yield | 1.21% |
| 200-day MA | $26.55 | Market Cap | 4.61B |
NVEI Stock Price Chart Interactive Chart >
Nuvei Corp. (NVEI) Company Bio
Nuvei Corp. engages in the provision of global payment solutions. The firm is a single source provider for mobile commerce and eCommerce payments technology. Its services include payment gateways, security and risk management, recurring and subscription billing, multi-currency pricing, dynamic currency conversion, and ACH payment processing services. The company was founded by Philip Fayer on September 1, 2017 and is headquartered in Montreal, Canada.
Latest NVEI News From Around the Web
Below are the latest news stories about NUVEI CORP that investors may wish to consider to help them evaluate NVEI as an investment opportunity.
Nuvei Stock Showing Rising Market Leadership; Earns 81 RS RatingNuvei shows rising price performance, earning an upgrade to its IBD Relative Strength Rating from 71 to 81. |
NVEI or EFX: Which Is the Better Value Stock Right Now?NVEI vs. EFX: Which Stock Is the Better Value Option? |
Familiprix selects Nuvei as payment partnerNuvei Corporation ("Nuvei" or the "Company") (Nasdaq: NVEI) (TSX: NVEI), the Canadian fintech company, is today announcing its partnership with Familiprix, a leading retail pharmacy network based in Quebec, Canada, to launch an eCommerce app that enables their affiliated pharmacists to accept online payments for the first time. |
Nuvei security standards now certified by ISO27001 & ISO27017Nuvei Corporation ("Nuvei" or the "Company") (Nasdaq: NVEI) (TSX: NVEI), the Canadian fintech company, announces today that it has received official certification under ISO ISO27001 and ISO27017 for information security management. This extends the company's certification to include all regions globally, as well as Nuvei's full cloud environment. |
Nuvei enters global payments partnership with MicrosoftNuvei Corporation ("Nuvei" or the "Company") (Nasdaq: NVEI) (TSX: NVEI), the Canadian fintech company, announces today that it has partnered with Microsoft to deliver leading payment experiences for customers of its products, solutions, and services across many of its key markets. |
NVEI Price Returns
| 1-mo | 1.86% |
| 3-mo | 2.27% |
| 6-mo | 34.22% |
| 1-year | 2.52% |
| 3-year | -59.28% |
| 5-year | N/A |
| YTD | 26.29% |
| 2023 | 4.34% |
| 2022 | -60.90% |
| 2021 | 7.01% |
| 2020 | N/A |
| 2019 | N/A |
NVEI Dividends
| Ex-Dividend Date | Type | Payout Amount | Change | ||||||
|---|---|---|---|---|---|---|---|---|---|
| Loading, please wait... | |||||||||
Loading social stream, please wait...