
InVivo Therapeutics Holdings Corp. (NVIV): Price and Financial Metrics
NVIV Price/Volume Stats
| Current price | $0.32 | 52-week high | $2.40 |
| Prev. close | $0.49 | 52-week low | $0.22 |
| Day low | $0.30 | Volume | 1,885,600 |
| Day high | $0.41 | Avg. volume | 8,249,015 |
| 50-day MA | $0.69 | Dividend yield | N/A |
| 200-day MA | $1.05 | Market Cap | 995.77K |
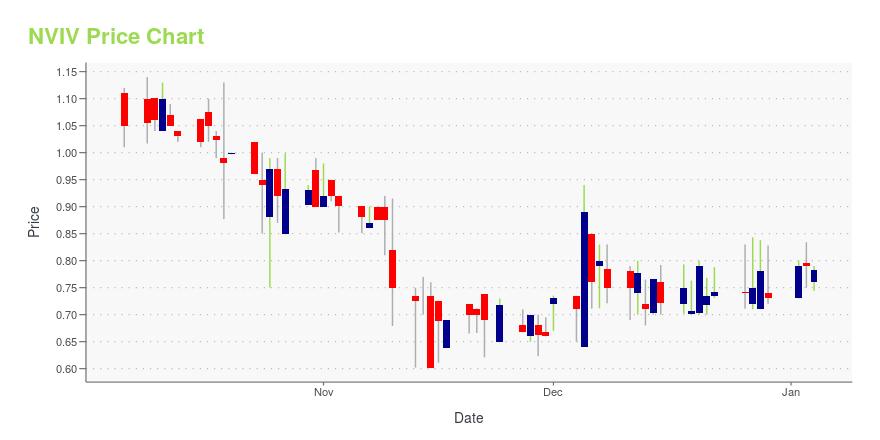
NVIV Stock Price Chart Interactive Chart >
InVivo Therapeutics Holdings Corp. (NVIV) Company Bio
InVivo Therapeutics is a research and clinical-stage biomaterials and biotechnology company with a focus on treatment of spinal cord injuries. The company was founded in 2005 and is based in Cambridge, Massachusetts.
Latest NVIV News From Around the Web
Below are the latest news stories about INVIVO THERAPEUTICS HOLDINGS CORP that investors may wish to consider to help them evaluate NVIV as an investment opportunity.
Why InVivo Therapeutics Shares Are Plunging TodayInVivo Therapeutics Holdings Corp (NASDAQ: NVIV) announced topline results from its INSPIRE 2.0 study of Neuro-Spinal Scaffold, a bioresorbable scaffold-based device for acute spinal cord injuries (SCI). The study did not meet its primary endpoint, which was assessed by the proportion of treated patients achieving an improvement of at least one American Spinal Injury Association (ASIA) Impairment Scale (AIS) grade at six months post-scaffold implantation versus a control group that received stan |
InVivo Therapeutics Announces Topline Data from Pivotal INSPIRE 2.0 Study in Acute Spinal Cord InjuryCAMBRIDGE, Mass., March 09, 2023--InVivo Therapeutics Holdings Corp. (Nasdaq: NVIV), a research and clinical-stage biomaterials and biotechnology company with a focus on the treatment of spinal cord injuries (SCI), today announced topline results from the company’s INSPIRE 2.0 study, which was designed to evaluate the safety and probable benefit of InVivo’s investigational Neuro-Spinal Scaffold™, a bioresorbable scaffold-based device in development for patients with acute SCI. The study did not |
NVIV Price Returns
| 1-mo | N/A |
| 3-mo | N/A |
| 6-mo | -52.68% |
| 1-year | -76.21% |
| 3-year | -97.87% |
| 5-year | -99.92% |
| YTD | -56.16% |
| 2023 | -68.94% |
| 2022 | -79.39% |
| 2021 | -43.69% |
| 2020 | -87.99% |
| 2019 | -85.11% |
Loading social stream, please wait...