Nova Measuring Instruments Ltd. - Ordinary Shares (NVMI): Price and Financial Metrics
GET POWR RATINGS... FREE!
NVMI POWR Grades
- Quality is the dimension where NVMI ranks best; there it ranks ahead of 94.56% of US stocks.
- The strongest trend for NVMI is in Stability, which has been heading down over the past 179 days.
- NVMI ranks lowest in Value; there it ranks in the 15th percentile.
NVMI Stock Summary
- Of note is the ratio of Nova Ltd's sales and general administrative expense to its total operating expenses; merely 22.56% of US stocks have a lower such ratio.
- With a price/sales ratio of 8.01, Nova Ltd has a higher such ratio than 81.98% of stocks in our set.
- As for revenue growth, note that NVMI's revenue has grown 42.26% over the past 12 months; that beats the revenue growth of 78.03% of US companies in our set.
- Stocks that are quantitatively similar to NVMI, based on their financial statements, market capitalization, and price volatility, are INSM, RDUS, INFN, CASA, and BYSI.
- Visit NVMI's SEC page to see the company's official filings. To visit the company's web site, go to www.novami.com.
NVMI Valuation Summary
- NVMI's price/sales ratio is 8.7; this is 59.63% higher than that of the median Technology stock.
- NVMI's price/earnings ratio has moved up 43.4 over the prior 227 months.
- Over the past 227 months, NVMI's price/sales ratio has gone up 7.6.
Below are key valuation metrics over time for NVMI.
Stock | Date | P/S | P/B | P/E | EV/EBIT |
---|---|---|---|---|---|
NVMI | 2021-09-01 | 8.7 | 6.8 | 41.7 | 34.3 |
NVMI | 2021-08-31 | 8.7 | 6.9 | 42.0 | 34.5 |
NVMI | 2021-08-30 | 8.8 | 6.9 | 42.1 | 34.6 |
NVMI | 2021-08-27 | 8.7 | 6.9 | 41.8 | 34.4 |
NVMI | 2021-08-26 | 8.5 | 6.7 | 40.7 | 33.4 |
NVMI | 2021-08-25 | 8.4 | 6.7 | 40.6 | 33.3 |
NVMI Growth Metrics
- The 4 year revenue growth rate now stands at 47.85%.
- Its 4 year cash and equivalents growth rate is now at 113.65%.
- Its year over year net cashflow from operations growth rate is now at 114.41%.

The table below shows NVMI's growth in key financial areas (numbers in millions of US dollars).
Date | Revenue | Operating Cash Flow | Net Income to Common Stock |
---|---|---|---|
2021-12-31 | 416.113 | 132.262 | 93.101 |
2021-12-31 | 416.113 | 132.262 | 93.101 |
2021-09-30 | 370.895 | 118.078 | 84.532 |
2021-06-30 | 327.667 | 87.035 | 68.093 |
2021-03-31 | 292.507 | 79.747 | 53.841 |
2020-12-31 | 269.396 | 60.253 | 47.907 |
NVMI's Quality Factors
The “Quality” component of the POWR Ratings focuses on 31 different factors of a companies fundamentals and operational strength. Here are some key insights as we drill into the specifics of these quality attributes.- NVMI has a Quality Grade of B, ranking ahead of 85.31% of graded US stocks.
- NVMI's asset turnover comes in at 0.522 -- ranking 45th of 76 Measuring and Control Equipment stocks.
- FTV, FLDM, and CAMT are the stocks whose asset turnover ratios are most correlated with NVMI.
The table below shows NVMI's key quality metrics over time.
Period | Asset Turnover | Gross Margin | ROIC |
---|---|---|---|
2021-06-30 | 0.522 | 0.567 | 0.272 |
2021-03-31 | 0.528 | 0.569 | 0.240 |
2020-12-31 | 0.556 | 0.568 | 0.260 |
2020-12-31 | 0.556 | 0.568 | 0.260 |
2020-09-30 | 0.612 | 0.564 | 0.332 |
2020-06-30 | 0.596 | 0.553 | 0.284 |
NVMI Price Target
For more insight on analysts targets of NVMI, see our NVMI price target page. And for a list of of all stocks sorted by upside potential based on analyst target price, see our Top Price Target page.
Average Price Target | $114.33 | Average Broker Recommendation | 1.25 (Strong Buy) |
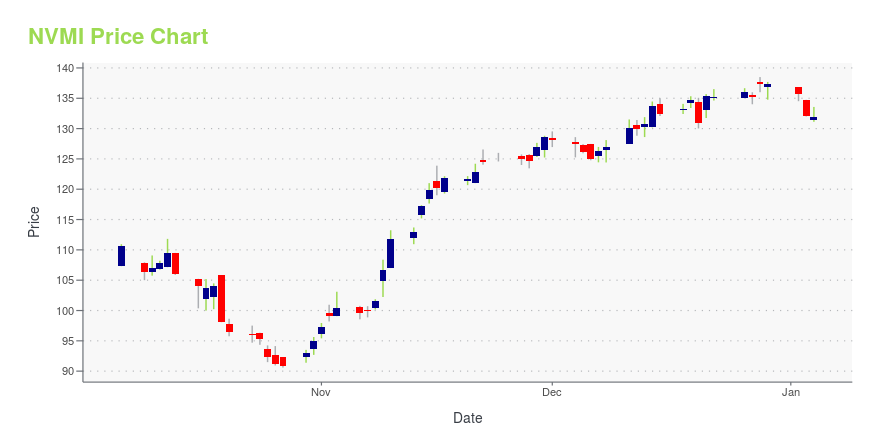
NVMI Stock Price Chart Interactive Chart >
NVMI Price/Volume Stats
Current price | $100.18 | 52-week high | $149.15 |
Prev. close | $97.96 | 52-week low | $90.38 |
Day low | $96.76 | Volume | 34,677 |
Day high | $100.18 | Avg. volume | 157,183 |
50-day MA | $102.79 | Dividend yield | N/A |
200-day MA | $112.00 | Market Cap | 2.87B |
Nova Measuring Instruments Ltd. - Ordinary Shares (NVMI) Company Bio
Nova Measuring Instruments is a provider of metrology solutions for advanced process control used in semiconductor manufacturing. The company was founded in 1993 and is based in Rehovot, Israel.
Latest NVMI News From Around the Web
Below are the latest news stories about Nova Ltd that investors may wish to consider to help them evaluate NVMI as an investment opportunity.
Nova Reports Fourth Quarter and Full Year 2021 ResultsNova (Nasdaq: NVMI) today announced financial results for the fourth quarter and full year 2021. |
Nova Expands Presence in China with New Office in ShanghaiNova (Nasdaq: NVMI) today announced the establishment of its new Chinese local corporate entity and the opening of a new Chinese headquarters in Shanghai. Nova's business in China has grown significantly in recent years, serving the expansion of the regional semiconductor industry. The new facility is part of Nova's strategy to strengthen its global sites to tighten customers' partnerships and support company's continued expansion in the region. |
What's in Store for Nova Measuring Instruments (NVMI) Q4 Earnings?Nova Measuring Instruments (NVMI) fourth-quarter 2021 performance is likely to have benefited from the robust demand of its expanding product portfolio across all main product lines. |
Nova Introduces Unique Portfolio to Address Next-Generation Logic Fabrication ChallengesNova (Nasdaq: NVMI) announced today its metrology portfolio for advanced gate-all-around (GAA). To enhance its market-leading portfolio, the Company is unveiling multiple advanced solutions uniquely equipped to address the manufacturing challenges of next-generation logic devices. |
This Small-Cap Stock Is Growing Revenues 43% Year-Over-Year. But Will Future Returns Measure Up?The stock market has gotten off to a rough start in 2022. Growth stocks -- and tech stocks in particular -- have underperformed. The VanEck Vectors Semiconductor ETF (NASDAQ: SMH) has pulled back 13.9% in 2022 after bagging a 41.9% return in 2021. |
NVMI Price Returns
1-mo | -0.73% |
3-mo | -10.95% |
6-mo | -20.76% |
1-year | 2.27% |
3-year | 295.50% |
5-year | 304.60% |
YTD | -31.62% |
2021 | 107.51% |
2020 | 86.62% |
2019 | 66.07% |
2018 | -12.08% |
2017 | 96.88% |
Continue Researching NVMI
Want to do more research on Nova Measuring Instruments Ltd's stock and its price? Try the links below:Nova Measuring Instruments Ltd (NVMI) Stock Price | Nasdaq
Nova Measuring Instruments Ltd (NVMI) Stock Quote, History and News - Yahoo Finance
Nova Measuring Instruments Ltd (NVMI) Stock Price and Basic Information | MarketWatch
Loading social stream, please wait...