
Novo Nordisk A/S ADR (NVO): Price and Financial Metrics
NVO Price/Volume Stats
| Current price | $77.02 | 52-week high | $148.15 |
| Prev. close | $79.83 | 52-week low | $57.00 |
| Day low | $76.62 | Volume | 8,143,800 |
| Day high | $78.38 | Avg. volume | 9,479,402 |
| 50-day MA | $67.57 | Dividend yield | 2.02% |
| 200-day MA | $92.38 | Market Cap | 345.63B |
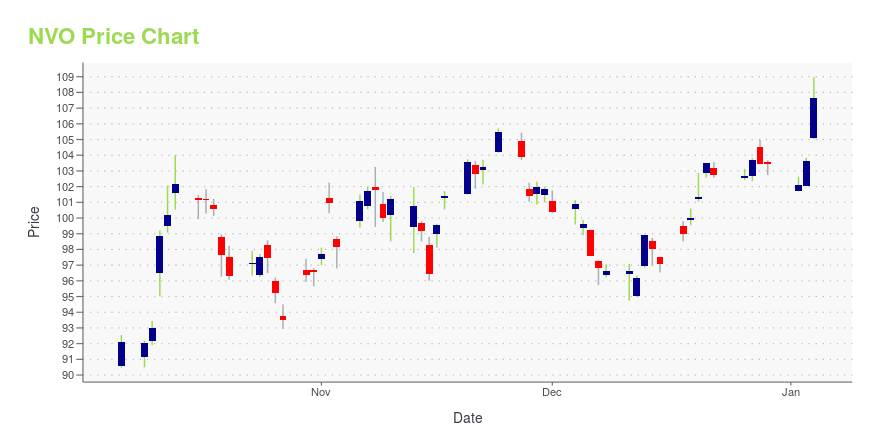
NVO Stock Price Chart Interactive Chart >
Novo Nordisk A/S ADR (NVO) Company Bio
Novo Nordisk A/S is a Danish multinational pharmaceutical company headquartered in Bagsværd, Denmark, with production facilities in nine countries, and affiliates or offices in five countries. Novo Nordisk is controlled by majority shareholder Novo Holdings A/S which holds approximately 25% of its shares and a supermajority (45%) of its voting shares. (Source:Wikipedia)
NVO Price Returns
| 1-mo | 19.65% |
| 3-mo | -1.34% |
| 6-mo | -24.65% |
| 1-year | -44.33% |
| 3-year | 50.46% |
| 5-year | 146.80% |
| YTD | -9.39% |
| 2024 | -16.20% |
| 2023 | 54.00% |
| 2022 | 22.12% |
| 2021 | 62.55% |
| 2020 | 22.56% |
NVO Dividends
| Ex-Dividend Date | Type | Payout Amount | Change | ||||||
|---|---|---|---|---|---|---|---|---|---|
| Loading, please wait... | |||||||||
Continue Researching NVO
Want to see what other sources are saying about Novo Nordisk A S's financials and stock price? Try the links below:Novo Nordisk A S (NVO) Stock Price | Nasdaq
Novo Nordisk A S (NVO) Stock Quote, History and News - Yahoo Finance
Novo Nordisk A S (NVO) Stock Price and Basic Information | MarketWatch
Loading social stream, please wait...