National Western Life Group, Inc. - (NWLI): Price and Financial Metrics
NWLI Price/Volume Stats
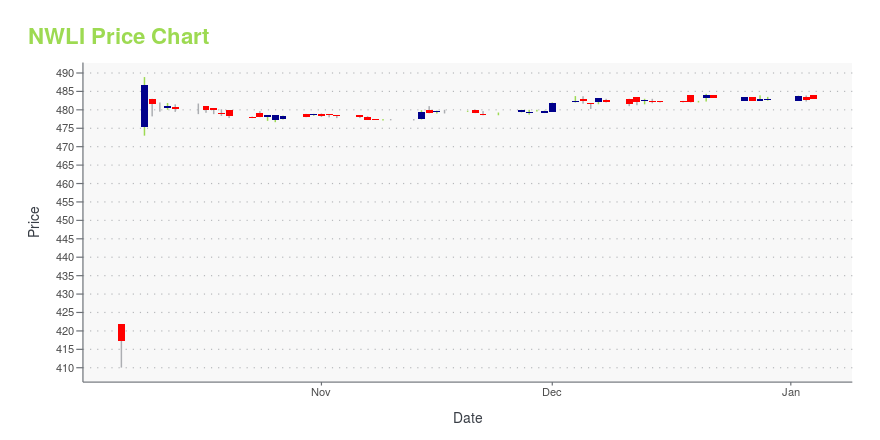
Current price | $446.07 | 52-week high | $476.63 |
Prev. close | $446.66 | 52-week low | $166.94 |
Day low | $445.53 | Volume | 3,900 |
Day high | $450.23 | Avg. volume | 10,592 |
50-day MA | $443.65 | Dividend yield | 0.08% |
200-day MA | $331.36 | Market Cap | 1.62B |
NWLI Stock Price Chart Interactive Chart >
NWLI POWR Grades
- Momentum is the dimension where NWLI ranks best; there it ranks ahead of 94.53% of US stocks.
- NWLI's strongest trending metric is Value; it's been moving down over the last 177 days.
- NWLI ranks lowest in Value; there it ranks in the 24th percentile.
NWLI Stock Summary
- NATIONAL WESTERN LIFE GROUP INC's stock had its IPO on March 26, 1990, making it an older stock than 85.48% of US equities in our set.
- Of note is the ratio of NATIONAL WESTERN LIFE GROUP INC's sales and general administrative expense to its total operating expenses; 87.23% of US stocks have a lower such ratio.
- The ratio of debt to operating expenses for NATIONAL WESTERN LIFE GROUP INC is higher than it is for about just 0.33% of US stocks.
- Stocks that are quantitatively similar to NWLI, based on their financial statements, market capitalization, and price volatility, are BSET, IMKTA, DSWL, WAFU, and CVR.
- Visit NWLI's SEC page to see the company's official filings. To visit the company's web site, go to www.nwlgi.com.
NWLI Valuation Summary
- In comparison to the median Financial Services stock, NWLI's price/sales ratio is 13.04% higher, now standing at 2.6.
- NWLI's price/sales ratio has moved up 1.1 over the prior 243 months.
Below are key valuation metrics over time for NWLI.
Stock | Date | P/S | P/B | P/E | EV/EBIT |
---|---|---|---|---|---|
NWLI | 2023-09-15 | 2.6 | 0.7 | 22.1 | 14.6 |
NWLI | 2023-09-14 | 2.6 | 0.7 | 22.0 | 14.5 |
NWLI | 2023-09-13 | 2.6 | 0.7 | 21.8 | 14.4 |
NWLI | 2023-09-12 | 2.5 | 0.7 | 21.6 | 14.2 |
NWLI | 2023-09-11 | 2.5 | 0.7 | 21.0 | 13.8 |
NWLI | 2023-09-08 | 2.6 | 0.7 | 21.9 | 14.5 |
NWLI Growth Metrics
- Its 2 year cash and equivalents growth rate is now at 37.49%.
- The 3 year price growth rate now stands at -27.23%.
- The 5 year price growth rate now stands at -43.17%.

The table below shows NWLI's growth in key financial areas (numbers in millions of US dollars).
Date | Revenue | Operating Cash Flow | Net Income to Common Stock |
---|---|---|---|
2022-09-30 | 611.996 | 514.078 | 117.523 |
2022-06-30 | 623.004 | 410.358 | 135.602 |
2022-03-31 | 728.012 | 293.642 | 154.736 |
2021-12-31 | 824.091 | 276.825 | 180.681 |
2021-09-30 | 830.961 | 91.013 | 187.004 |
2021-06-30 | 878.782 | 170.248 | 157.989 |
NWLI's Quality Factors
The “Quality” component of the POWR Ratings focuses on 31 different factors of a companies fundamentals and operational strength. Here are some key insights as we drill into the specifics of these quality attributes.- NWLI has a Quality Grade of C, ranking ahead of 27.91% of graded US stocks.
- NWLI's asset turnover comes in at 0.063 -- ranking 118th of 133 Insurance stocks.
- AEL, FAF, and ANAT are the stocks whose asset turnover ratios are most correlated with NWLI.
The table below shows NWLI's key quality metrics over time.
Period | Asset Turnover | Gross Margin | ROIC |
---|---|---|---|
2021-06-30 | 0.063 | 0.507 | 0.014 |
2021-03-31 | 0.065 | 0.516 | 0.015 |
2020-12-31 | 0.054 | 0.514 | 0.009 |
2020-09-30 | 0.057 | 0.513 | 0.010 |
2020-06-30 | 0.054 | 0.512 | 0.011 |
2020-03-31 | 0.052 | 0.496 | 0.009 |
National Western Life Group, Inc. - (NWLI) Company Bio
National Western Life Insurance Company operates in two segments: Domestic Insurance Operations and International Insurance Operations. The products marketed under domestic insurance operations are annuities, universal life insurance and traditional life insurance, which include both term and whole life products. The company was founded in 1956 and is based in Austin, Texas.
Latest NWLI News From Around the Web
Below are the latest news stories about NATIONAL WESTERN LIFE GROUP INC that investors may wish to consider to help them evaluate NWLI as an investment opportunity.
National Western Life Group Second Quarter 2023 Earnings: EPS: US$8.15 (vs US$8.46 in 2Q 2022)National Western Life Group ( NASDAQ:NWLI ) Second Quarter 2023 Results Key Financial Results Revenue: US$186.2m (up... |
National Western Life Group, Inc. Announces 2023 Second Quarter EarningsRoss R. Moody, Chairman of the Board, President, and Chief Executive Officer of National Western Life Group, Inc. (Nasdaq: NWLI), announced today second quarter 2023 consolidated net earnings of $29.6 million, or $8.38 per diluted share of Class A Common Stock, compared with restated consolidated net earnings of $96.5 million, or $27.30 per diluted share of Class A Common Stock, for the second quarter ended June 30, 2022. For the six months ended June 30, 2023, the Company reported consolidated |
Why Shares of National Western Life Group, SelectQuote, and United Insurance Are Blasting Higher This WeekShares of life insurance company National Western Life Group (NASDAQ: NWLI) traded more than 52% higher for the week as of 1:30 p.m. ET Thursday, according to data from S&P Global Market Intelligence. Meanwhile, shares of insurance marketplace SelectQuote (NYSE: SLQT) traded roughly 40% higher, while shares of the property and casualty insurer United Insurance (NASDAQ: UIHC) were up nearly 24%. National Western Life Group has had an eventful week. |
Stocks Post Afternoon Gains As "Fear Gauge" CoolsWall Street is holding onto premarket gains, with the Dow Jones Industrial Average up more than 120 points. |
National Western Life Group, Inc. Announces Exploration of Strategic AlternativesNational Western Life Group, Inc. (Nasdaq: NWLI) (the "Company" or "NWLGI") today announced that the Company is exploring strategic alternatives in order to maximize value for the Company's stockholders. |
NWLI Price Returns
1-mo | -2.84% |
3-mo | 11.77% |
6-mo | 88.53% |
1-year | 161.79% |
3-year | 144.81% |
5-year | 40.69% |
YTD | 58.74% |
2022 | 31.28% |
2021 | 4.04% |
2020 | -28.89% |
2019 | -3.15% |
2018 | -9.04% |
NWLI Dividends
Ex-Dividend Date | Type | Payout Amount | Change | ||||||
---|---|---|---|---|---|---|---|---|---|
Loading, please wait... |
Continue Researching NWLI
Want to see what other sources are saying about National Western Life Group Inc's financials and stock price? Try the links below:National Western Life Group Inc (NWLI) Stock Price | Nasdaq
National Western Life Group Inc (NWLI) Stock Quote, History and News - Yahoo Finance
National Western Life Group Inc (NWLI) Stock Price and Basic Information | MarketWatch
Loading social stream, please wait...