NextGen Healthcare, Inc. (NXGN): Price and Financial Metrics

NextGen Healthcare, Inc. (NXGN): $15.35

-0.10 (-0.65%)

POWR Rating

Component Grades

Growth

S

Value

I

Momentum

G

Stability

N

Sentiment

U

Quality

P

NXGN Price/Volume Stats
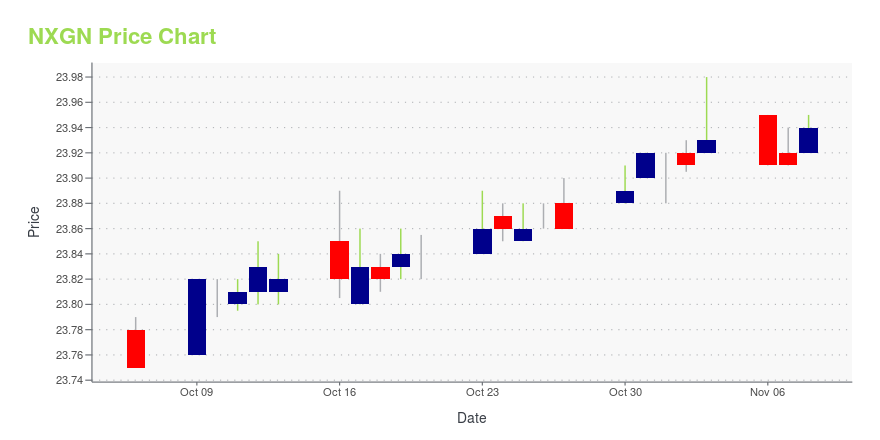
Current price $15.35 52-week high $21.99
Prev. close $15.45 52-week low $15.23
Day low $15.33 Volume 356,500
Day high $15.63 Avg. volume 408,647
50-day MA $16.94 Dividend yield N/A
200-day MA $18.03 Market Cap 1.01B

NXGN Stock Price Chart Interactive Chart >

NXGN POWR Grades

  • Growth is the dimension where NXGN ranks best; there it ranks ahead of 85.41% of US stocks.
  • The strongest trend for NXGN is in Quality, which has been heading down over the past 179 days.
  • NXGN's current lowest rank is in the Sentiment metric (where it is better than 6.37% of US stocks).

NXGN Stock Summary

  • With a year-over-year growth in debt of 1,272.24%, NEXTGEN HEALTHCARE INC's debt growth rate surpasses 98.77% of about US stocks.
  • In terms of volatility of its share price, NXGN is more volatile than merely 10.59% of stocks we're observing.
  • NEXTGEN HEALTHCARE INC's shareholder yield -- a measure of how much capital is returned to stockholders via dividends and buybacks -- is -21.66%, greater than the shareholder yield of only 17.89% of stocks in our set.
  • Stocks with similar financial metrics, market capitalization, and price volatility to NEXTGEN HEALTHCARE INC are INVE, TTWO, VRNT, TELL, and EGRX.
  • Visit NXGN's SEC page to see the company's official filings. To visit the company's web site, go to www.nextgen.com.

NXGN Valuation Summary

  • NXGN's EV/EBIT ratio is 30.5; this is 44.21% higher than that of the median Technology stock.
  • NXGN's EV/EBIT ratio has moved up 16.6 over the prior 243 months.

Below are key valuation metrics over time for NXGN.

Stock Date P/S P/B P/E EV/EBIT
NXGN 2023-05-22 1.6 2.5 45.0 30.5
NXGN 2023-05-19 1.7 2.5 45.3 30.6
NXGN 2023-05-18 1.7 2.5 45.6 30.8
NXGN 2023-05-17 1.7 2.6 46.5 31.4
NXGN 2023-05-16 1.8 2.7 48.6 32.8
NXGN 2023-05-15 1.8 2.7 48.3 32.6

NXGN Growth Metrics

    Its 3 year price growth rate is now at -5.91%.
  • The 5 year net cashflow from operations growth rate now stands at -22.6%.
  • Its 5 year net income to common stockholders growth rate is now at -58.89%.
NXGN's revenue has moved up $85,642,000 over the prior 34 months.

The table below shows NXGN's growth in key financial areas (numbers in millions of US dollars).

Date Revenue Operating Cash Flow Net Income to Common Stock
2022-12-31 625.881 52.886 22.934
2022-09-30 613.725 66.862 20.312
2022-06-30 603.568 48.587 -0.082
2022-03-31 596.35 53.545 1.618
2021-12-31 589.279 59.176 0.69
2021-09-30 581.31 70.965 -4.039

NXGN's Quality Factors

The “Quality” component of the POWR Ratings focuses on 31 different factors of a companies fundamentals and operational strength. Here are some key insights as we drill into the specifics of these quality attributes.
  • NXGN has a Quality Grade of B, ranking ahead of 82.41% of graded US stocks.
  • NXGN's asset turnover comes in at 0.908 -- ranking 27th of 83 Computers stocks.
  • CLSK, EXTR, and ANET are the stocks whose asset turnover ratios are most correlated with NXGN.

The table below shows NXGN's key quality metrics over time.

Period Asset Turnover Gross Margin ROIC
2021-09-30 0.908 0.509 -0.041
2021-06-30 0.881 0.507 0.125
2021-03-31 0.812 0.505 0.075
2020-12-31 0.779 0.501 0.035
2020-09-30 0.783 0.501 0.044
2020-06-30 0.803 0.502 0.031

NXGN Price Target

For more insight on analysts targets of NXGN, see our NXGN price target page. And for a list of of all stocks sorted by upside potential based on analyst target price, see our Top Price Target page.

Average Price Target $20.38 Average Broker Recommendation 1.93 (Hold)

NextGen Healthcare, Inc. (NXGN) Company Bio


NextGen Healthcare (formerly Quality Systems) develops and markets computer-based practice management, electronic health records and revenue cycle management applications as well as connectivity products and services for medical and dental group practices and small hospitals. The company was founded in 1974 and is based in Irvine, California.


NXGN Latest News Stream


Event/Time News Detail
Loading, please wait...

NXGN Latest Social Stream


Loading social stream, please wait...

View Full NXGN Social Stream

Latest NXGN News From Around the Web

Below are the latest news stories about NEXTGEN HEALTHCARE INC that investors may wish to consider to help them evaluate NXGN as an investment opportunity.

NextGen Healthcare, Inc. (NXGN) Q4 2023 Earnings Call Transcript

NextGen Healthcare, Inc. (NXGN)

Q4 2023 Earnings Conference Call

May 16, 2023, 17:00 ET

Company Participants

James Hammerschmidt - SVP, Finance & Investor Relations

David Sides - CEO, President & Director

James Arnold - EVP & CFO

Conference Call Participants

Anna Kruszenski - SVB Securities

Jack Wallace - Guggenheim Securities

Jeffrey Garro - Stephens Inc.

Eduardo Ron - Truist Securities

Vishal Patel - Piper Sandler & Co.

George Hill - Deutsche Bank

Presentation

Operator

Welcome to the NextGen Healthcare Fiscal 2023 Fourth Quarter Results Conference Call. Hosting the call today from NextGen are David Sides,...

SA Transcripts on Seeking Alpha | May 17, 2023

NextGen (NXGN) Q4 Earnings Top Estimates, Revenues Surge Y/Y

NextGen's (NXGN) fourth-quarter fiscal 2023 results reflect strength in both its revenue sources.

Yahoo | May 17, 2023

NextGen Healthcare, Inc. (NASDAQ:NXGN) Q4 2023 Earnings Call Transcript

NextGen Healthcare, Inc. (NASDAQ:NXGN) Q4 2023 Earnings Call Transcript May 16, 2023 NextGen Healthcare, Inc. misses on earnings expectations. Reported EPS is $0.1 EPS, expectations were $0.29. Operator: Welcome to the NextGen Healthcare Fiscal 2023 Fourth Quarter Results Conference Call. Hosting the call today from NextGen are David Sides, President and Chief Executive Officer; and […]

Yahoo | May 17, 2023

Q4 2023 NextGen Healthcare Inc Earnings Call

Q4 2023 NextGen Healthcare Inc Earnings Call

Yahoo | May 17, 2023

Nextgen Healthcare (NXGN) Q4 Earnings: Taking a Look at Key Metrics Versus Estimates

While the top- and bottom-line numbers for Nextgen Healthcare (NXGN) give a sense of how the business performed in the quarter ended March 2023, it could be worth looking at how some of its key metrics compare to Wall Street estimates and year-ago values.

Yahoo | May 16, 2023

Read More 'NXGN' Stories Here

NXGN Price Returns

1-mo -8.30%
3-mo -15.24%
6-mo -26.20%
1-year -16.71%
3-year 48.74%
5-year -8.79%
YTD -18.26%
2022 5.56%
2021 -2.47%
2020 13.50%
2019 6.07%
2018 11.56%

Get Free Updates

Join thousands of investors who get the latest news, insights and top rated picks from StockNews.com!


Page generated in 0.8734 seconds.