
Orthofix Medical Inc. (OFIX): Price and Financial Metrics
OFIX Price/Volume Stats
| Current price | $16.51 | 52-week high | $21.60 |
| Prev. close | $16.51 | 52-week low | $9.57 |
| Day low | $16.21 | Volume | 242,940 |
| Day high | $16.92 | Avg. volume | 361,256 |
| 50-day MA | $14.29 | Dividend yield | N/A |
| 200-day MA | $13.32 | Market Cap | 619.60M |
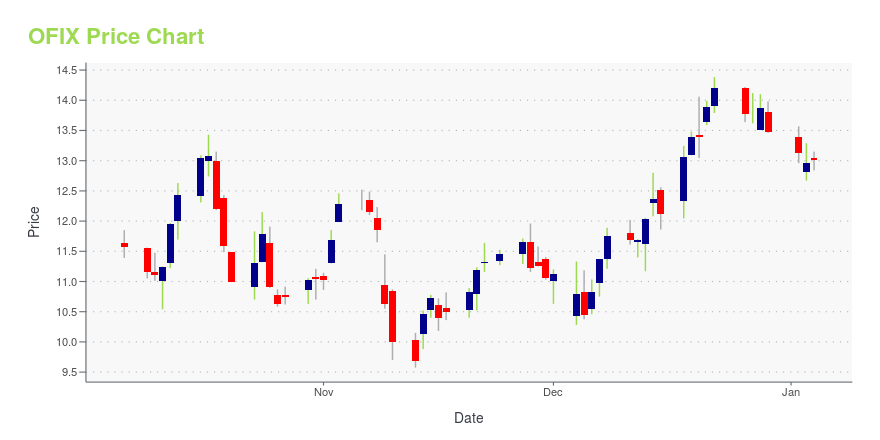
OFIX Stock Price Chart Interactive Chart >
Orthofix Medical Inc. (OFIX) Company Bio
Orthofix International provides reconstructive and regenerative orthopedic and spine solutions to physicians. It operates through four segments: BioStim, Biologics, Extremity Fixation, and Spine Fixation. The company was founded in 1987 and is based in Willemstad, Curaçao.
Latest OFIX News From Around the Web
Below are the latest news stories about ORTHOFIX MEDICAL INC that investors may wish to consider to help them evaluate OFIX as an investment opportunity.
Orthofix (OFIX) Releases New Data for Spinal Fusion ProceduresAccording to Orthofix (OFIX), this data highlights the noninvasive and cost-effective nature of SpinalStim, enabling patients to continue their healing in the comfort of their homes. |
Orthofix Announces Publication of New Data Supporting Use of PEMF Stimulation in Lumbar Spine Fusion Procedures for Patients at Risk of PseudarthrosisLEWISVILLE, Texas, December 21, 2023--New data supports use of SpinalStim as adjunct therapy for patients at high risk of pseudarthrosis after lumbar spine fusion procedures. |
Orthofix Announces Agreement with Engine Capital and Appointment of Three New Independent Directors to Further Advance Position as Leading Global Spine and Orthopedics CompanyLEWISVILLE, Texas, December 12, 2023--Orthofix Medical Inc. (NASDAQ: OFIX) ("Orthofix" or the "Company") today announced the appointment of three new independent directors to the Company’s Board. These new directors bring substantial finance, strategic development, healthcare and medical technology experience to further advance Orthofix’s position as a leading global spine and orthopedics company. The appointments follow constructive engagement and entry into a cooperation agreement with Engine |
Wall Street Analysts Believe Orthofix (OFIX) Could Rally 72.19%: Here's is How to TradeThe average of price targets set by Wall Street analysts indicates a potential upside of 72.2% in Orthofix (OFIX). While the effectiveness of this highly sought-after metric is questionable, the positive trend in earnings estimate revisions might translate into an upside in the stock. |
Uber Technologies, Jabil and Builders FirstSource Set to Join S&P 500; Others to Join S&P MidCap 400 and S&P SmallCap 600S&P Dow Jones Indices ("S&P DJI") will make the following changes to the S&P 500, S&P MidCap 400, and S&P SmallCap 600 indices effective prior to the open of trading on Monday, December 18, to coincide with the quarterly rebalance. The changes ensure each index is more representative of its market capitalization range. All companies being added to the S&P 500 are more representative of the large-cap market space, all companies being added to the S&P MidCap 400 are more representative of the mid- |
OFIX Price Returns
| 1-mo | 24.89% |
| 3-mo | 27.10% |
| 6-mo | 14.34% |
| 1-year | -15.59% |
| 3-year | -56.83% |
| 5-year | -66.89% |
| YTD | 22.48% |
| 2023 | -34.34% |
| 2022 | -33.97% |
| 2021 | -27.66% |
| 2020 | -6.93% |
| 2019 | -12.02% |
Continue Researching OFIX
Here are a few links from around the web to help you further your research on Orthofix Medical Inc's stock as an investment opportunity:Orthofix Medical Inc (OFIX) Stock Price | Nasdaq
Orthofix Medical Inc (OFIX) Stock Quote, History and News - Yahoo Finance
Orthofix Medical Inc (OFIX) Stock Price and Basic Information | MarketWatch
Loading social stream, please wait...