Omega Healthcare Investors, Inc. (OHI): Price and Financial Metrics
GET POWR RATINGS... FREE!
OHI POWR Grades
- Quality is the dimension where OHI ranks best; there it ranks ahead of 86.79% of US stocks.
- OHI's strongest trending metric is Stability; it's been moving down over the last 178 days.
- OHI ranks lowest in Growth; there it ranks in the 0th percentile.
OHI Stock Summary
- With a one year PEG ratio of 1,018.05, OMEGA HEALTHCARE INVESTORS INC is expected to have a higher PEG ratio (a measure of how expensive a stock is relative to its expected earnings growth) than 97.1% of US stocks.
- Of note is the ratio of OMEGA HEALTHCARE INVESTORS INC's sales and general administrative expense to its total operating expenses; merely 4.79% of US stocks have a lower such ratio.
- The ratio of debt to operating expenses for OMEGA HEALTHCARE INVESTORS INC is higher than it is for about 91.69% of US stocks.
- Stocks with similar financial metrics, market capitalization, and price volatility to OMEGA HEALTHCARE INVESTORS INC are DEA, INVH, EPR, DEI, and ADC.
- OHI's SEC filings can be seen here. And to visit OMEGA HEALTHCARE INVESTORS INC's official web site, go to www.omegahealthcare.com.
OHI Valuation Summary
- OHI's price/sales ratio is 7.3; this is 69.77% higher than that of the median Real Estate stock.
- Over the past 243 months, OHI's price/earnings ratio has gone up 17.7.
Below are key valuation metrics over time for OHI.
Stock | Date | P/S | P/B | P/E | EV/EBIT |
---|---|---|---|---|---|
OHI | 2023-03-10 | 7.3 | 1.8 | 15.1 | 17.2 |
OHI | 2023-03-09 | 7.5 | 1.8 | 15.4 | 17.4 |
OHI | 2023-03-08 | 7.5 | 1.8 | 15.5 | 17.4 |
OHI | 2023-03-07 | 7.4 | 1.8 | 15.2 | 17.2 |
OHI | 2023-03-06 | 7.3 | 1.8 | 15.0 | 17.2 |
OHI | 2023-03-03 | 7.2 | 1.8 | 14.8 | 17.0 |
OHI Growth Metrics
- Its year over year net income to common stockholders growth rate is now at 94.59%.
- Its 2 year net cashflow from operations growth rate is now at 16.41%.
- Its 4 year revenue growth rate is now at 4.18%.

The table below shows OHI's growth in key financial areas (numbers in millions of US dollars).
Date | Revenue | Operating Cash Flow | Net Income to Common Stock |
---|---|---|---|
2022-12-31 | 878.244 | 625.727 | 426.927 |
2022-09-30 | 983.343 | 628.574 | 414.639 |
2022-06-30 | 1,025.585 | 649.005 | 451.312 |
2022-03-31 | 1,038.356 | 678.363 | 446.368 |
2021-12-31 | 1,062.809 | 722.136 | 416.739 |
2021-09-30 | 1,076.645 | 762.966 | 444.844 |
OHI's Quality Factors
The “Quality” component of the POWR Ratings focuses on 31 different factors of a companies fundamentals and operational strength. Here are some key insights as we drill into the specifics of these quality attributes.- OHI has a Quality Grade of C, ranking ahead of 66.02% of graded US stocks.
- OHI's asset turnover comes in at 0.095 -- ranking 224th of 444 Trading stocks.
- SCHW, EPR, and DHC are the stocks whose asset turnover ratios are most correlated with OHI.
The table below shows OHI's key quality metrics over time.
Period | Asset Turnover | Gross Margin | ROIC |
---|---|---|---|
2021-06-30 | 0.095 | 0.988 | 0.032 |
2021-03-31 | 0.095 | 0.988 | 0.033 |
2020-12-31 | 0.092 | 0.986 | 0.027 |
2020-09-30 | 0.090 | 0.986 | 0.027 |
2020-06-30 | 0.103 | 0.986 | 0.044 |
2020-03-31 | 0.101 | 0.985 | 0.042 |
OHI Price Target
For more insight on analysts targets of OHI, see our OHI price target page. And for a list of of all stocks sorted by upside potential based on analyst target price, see our Top Price Target page.
Average Price Target | $38.64 | Average Broker Recommendation | 1.71 (Moderate Buy) |
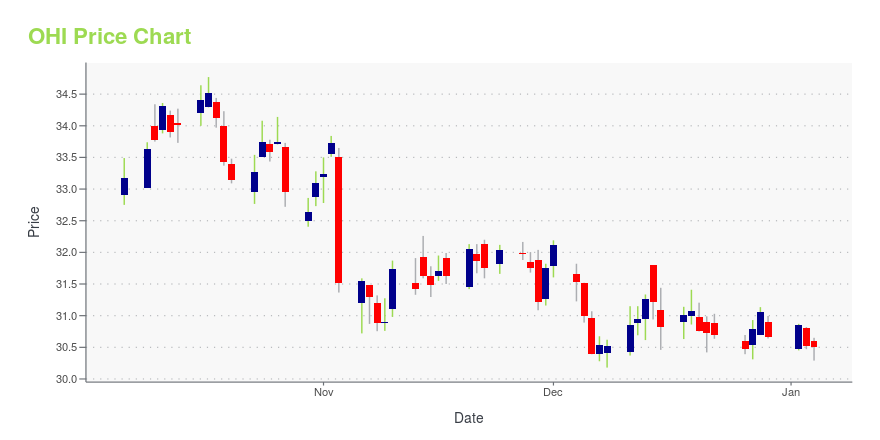
OHI Stock Price Chart Interactive Chart >
OHI Price/Volume Stats
Current price | $27.26 | 52-week high | $33.71 |
Prev. close | $27.04 | 52-week low | $24.81 |
Day low | $27.10 | Volume | 1,763,100 |
Day high | $27.56 | Avg. volume | 2,473,490 |
50-day MA | $28.03 | Dividend yield | 9.62% |
200-day MA | $29.83 | Market Cap | 6.39B |
Omega Healthcare Investors, Inc. (OHI) Company Bio
Omega Healthcare Investors Inc. is a real estate investment trust investing in and providing financing to the long-term care industry. The company was founded in 1992 and is based in Maryland, United States.
Latest OHI News From Around the Web
Below are the latest news stories about OMEGA HEALTHCARE INVESTORS INC that investors may wish to consider to help them evaluate OHI as an investment opportunity.
Omega Healthcare Investors (OHI) Gains As Market Dips: What You Should KnowOmega Healthcare Investors (OHI) closed the most recent trading day at $27.61, moving +0.77% from the previous trading session. |
Omega Healthcare Investors, Inc. (NYSE:OHI) Fell Short of Analyst Expectations: Here's What You Need To KnowOmega Healthcare Investors, Inc. ( NYSE:OHI ) missed earnings with its latest full-year results, disappointing... |
Omega Healthcare Investors, Inc. (NYSE:OHI) Q4 2022 Earnings Call TranscriptOmega Healthcare Investors, Inc. (NYSE:OHI) Q4 2022 Earnings Call Transcript February 3, 2023 Operator: Good morning. And welcome to the Omega Healthcare Investors Fourth Quarter 2022 Earnings Conference Call. All participants will be in listen-only mode. After today’s presentation, there will be an opportunity to ask questions. Please note, this event is being recorded. I […] |
Omega Healthcare Investors (OHI) Q4 2022 Earnings Call TranscriptWith me today are Omega CEO Taylor Pickett, COO Dan Booth, CFO Bob Stephenson, and Megan Krull, senior vice president of operations. Comments made during this conference call that are not historical facts may be forward-looking statements such as statements regarding our financial projections, dividend policy, portfolio restructurings, rent payments, financial condition, or prospects of our operators, contemplated acquisitions, dispositions or transitions, and our business and portfolio outlook, generally. During the call today, we will refer to some non-GAAP financial measures, such as NAREIT FFO, adjusted FFO, FAD, and EBITDA. |
Omega Healthcare Investors (OHI) Reports Q4 Earnings: What Key Metrics Have to SayThe headline numbers for Omega Healthcare Investors (OHI) give insight into how the company performed in the quarter ended December 2022, but it may be worthwhile to compare some of its key metrics to Wall Street estimates and the year-ago actuals. |
OHI Price Returns
1-mo | -3.44% |
3-mo | -1.09% |
6-mo | -7.46% |
1-year | 2.58% |
3-year | 57.29% |
5-year | 54.27% |
YTD | -0.24% |
2022 | 3.50% |
2021 | -12.06% |
2020 | -6.81% |
2019 | 29.01% |
2018 | 40.06% |
OHI Dividends
Ex-Dividend Date | Type | Payout Amount | Change | ||||||
---|---|---|---|---|---|---|---|---|---|
Loading, please wait... |
Continue Researching OHI
Want to see what other sources are saying about Omega Healthcare Investors Inc's financials and stock price? Try the links below:Omega Healthcare Investors Inc (OHI) Stock Price | Nasdaq
Omega Healthcare Investors Inc (OHI) Stock Quote, History and News - Yahoo Finance
Omega Healthcare Investors Inc (OHI) Stock Price and Basic Information | MarketWatch
Loading social stream, please wait...