
Omnicom Group Inc. (OMC): Price and Financial Metrics
OMC Price/Volume Stats
| Current price | $95.82 | 52-week high | $99.23 |
| Prev. close | $95.69 | 52-week low | $72.20 |
| Day low | $95.55 | Volume | 1,029,200 |
| Day high | $96.74 | Avg. volume | 1,644,854 |
| 50-day MA | $93.39 | Dividend yield | 2.96% |
| 200-day MA | $84.45 | Market Cap | 18.76B |
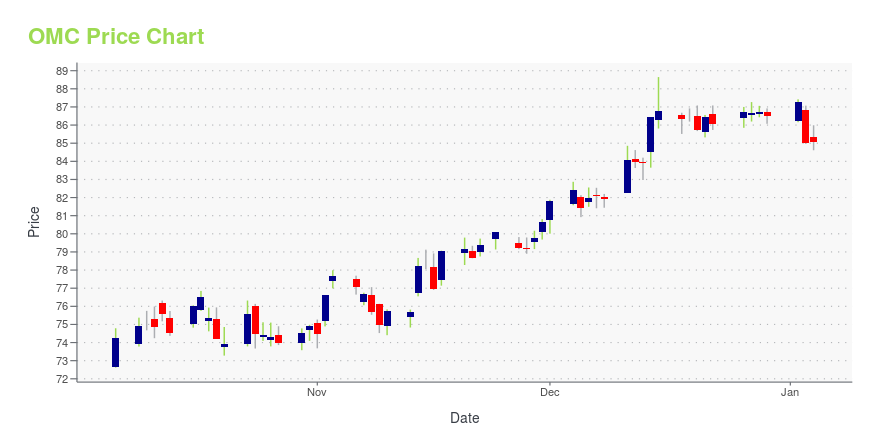
OMC Stock Price Chart Interactive Chart >
Omnicom Group Inc. (OMC) Company Bio
Omnicom Group Inc. is an American global media, marketing and corporate communications holding company, headquartered in New York City, E Omnicom's branded networks and specialty firms provide services in four disciplines: advertising, customer relationship management (CRM), public relations and specialty services. The services included in these disciplines are media planning and buying, digital and interactive marketing, sports and events marketing, field marketing and brand consultancy.Omnicom Group was ranked as one of the four largest advertising agencies in the world by The New York Times in 2002. In 2014, Omnicom was considered the second largest advertising holding company by The Wall Street Journal. The company employs more than 77,000 employees in over 100 countries worldwide. (Source:Wikipedia)
Latest OMC News From Around the Web
Below are the latest news stories about OMNICOM GROUP INC that investors may wish to consider to help them evaluate OMC as an investment opportunity.
The Zacks Analyst Blog Highlights 3M, Omnicom, Amcor, NiSource and NRG Energy3M, Omnicom, Amcor, NiSource and NRG Energy are included in this Analyst Blog. |
Communication Services Sector Buy Them Cheap Enough For Growth & IncomeThe Communications Services Sector is primarily thought of as lower-growth or moderately slow-growth income producers. But if you buy them cheap enough, they can also produce great profits in the long run. |
Omnicom Media Group Ends 2023 Ranked #1 for Net New Business for the Second Consecutive Year, Earns 97% Retention Rate Among Existing ClientsOmnicom Media Group (OMG), the media services division of Omnicom Group Inc. (NYSE: OMC) and parent company to the OMD, PHD and Hearts & Science global media agency networks, is poised to end 2023 with the best net new business record (wins minus losses) among global media management groups, marking the second consecutive year that OMG has led its category in incremental billings won. |
Mastercard (MA) Solutions Suite to Ease Payments in NigeriaMastercard (MA) extends its contactless payment solutions suite to merchants and consumers of Nigeria, who will benefit from the seamless processing of payments. |
5 Amazing Dividend Stocks to Buy for Secure Income in 2024Investors leveraging dividend-paying stocks to build a portfolio that emphasizes quality and sustainability can effectively weather market risks. Stocks like MMM, OMC, AMCR, NI and NRG are must-haves for your portfolio. |
OMC Price Returns
| 1-mo | 4.42% |
| 3-mo | 14.14% |
| 6-mo | 28.52% |
| 1-year | 8.60% |
| 3-year | 27.28% |
| 5-year | 44.77% |
| YTD | 11.60% |
| 2023 | 9.57% |
| 2022 | 15.72% |
| 2021 | 21.88% |
| 2020 | -19.58% |
| 2019 | 14.37% |
OMC Dividends
| Ex-Dividend Date | Type | Payout Amount | Change | ||||||
|---|---|---|---|---|---|---|---|---|---|
| Loading, please wait... | |||||||||
Continue Researching OMC
Here are a few links from around the web to help you further your research on Omnicom Group Inc's stock as an investment opportunity:Omnicom Group Inc (OMC) Stock Price | Nasdaq
Omnicom Group Inc (OMC) Stock Quote, History and News - Yahoo Finance
Omnicom Group Inc (OMC) Stock Price and Basic Information | MarketWatch
Loading social stream, please wait...