
OneMain Holdings, Inc. (OMF): Price and Financial Metrics
OMF Price/Volume Stats
| Current price | $53.09 | 52-week high | $53.65 |
| Prev. close | $52.45 | 52-week low | $35.00 |
| Day low | $52.75 | Volume | 513,500 |
| Day high | $53.50 | Avg. volume | 947,703 |
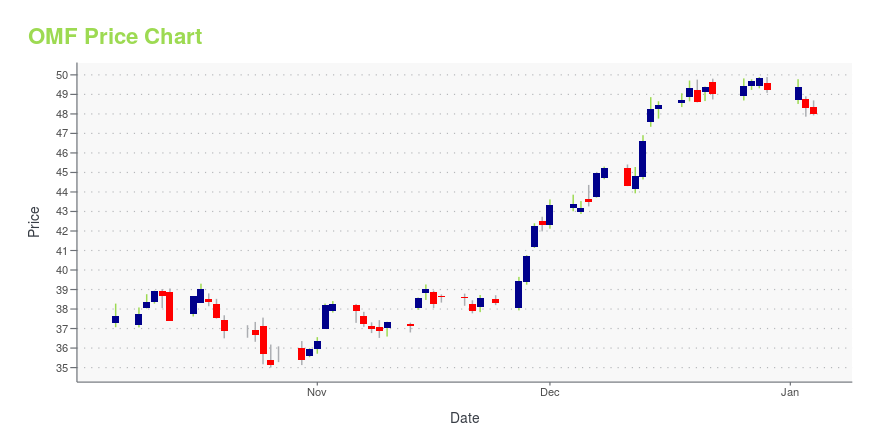
| 50-day MA | $49.15 | Dividend yield | 7.99% |
| 200-day MA | $46.53 | Market Cap | 6.36B |
OMF Stock Price Chart Interactive Chart >
OneMain Holdings, Inc. (OMF) Company Bio
OneMain Holdings, Inc., through its subsidiaries, provides consumer finance and credit insurance products and services. It provides personal loans secured by consumer household goods, and other personal property; and unsecured loans. The company also offers auto loans for purchasing new vehicles, as well as to pay off the existing auto loans. In addition, it writes credit life, credit accident and health, credit involuntary unemployment, and credit related property and casualty insurance products; non-credit insurance products; and offers auto security membership plans. The company was formerly known as Springleaf Holdings, Inc. and changed its name to OneMain Holdings, Inc. in November 2015. The company was founded in 1920 and is based in Evansville, Indiana.
Latest OMF News From Around the Web
Below are the latest news stories about ONEMAIN HOLDINGS INC that investors may wish to consider to help them evaluate OMF as an investment opportunity.
How TMSL Finds Opportunities in Small Cap StocksSmall-cap stocks may be in the midst of a much-discussed rebound. While that may surprise some, given the challenges posed for small-caps by high interest rates, there is good reason for it. Small caps remain much cheaper than they have been historically. That presents an intriguing opportunity to get into small-caps, especially if a rate [...] |
OneMain to Discuss its Differentiated Business Model and Disciplined Strategy to Drive Profitable Growth and Capital Generation at 2023 Investor DayOneMain Financial (NYSE: OMF), the leader in offering nonprime consumers responsible access to credit, will host its Investor Day today beginning at 1:00 p.m. Eastern time. Members of OneMain's executive management team will discuss the Company's competitive strengths, differentiated business model and disciplined strategy to substantially expand its addressable market, drive profitable growth and sustain strong capital generation. |
OneMain to Host an Investor Day on December 6, 2023OneMain Holdings, Inc. (NYSE: OMF), the leader in offering nonprime customers responsible access to credit, will host an Investor Day on Wednesday, Dec. 6, 2023, in New York City. The event will feature presentations from Doug Shulman, the company's Chairman and CEO, and other members of the company's executive management team. |
Billionaire Leon Cooperman’s Long-Term Stock PicksIn this piece, we will take a look at Leon Cooperman’s long term stock picks. If you want to skip our introduction to the billionaire hedge fund investor and the latest stock market news, then take a look at Billionaire Leon Cooperman’s Long-Term Stock Picks: Top 5 Stocks. Leon Cooperman is one of the most […] |
OneMain (OMF) Seeks Auto Expansion, Signs Deal to Buy FoursightOneMain (OMF) agrees to acquire Foursight from Jefferies (JEF) for $115 million in cash. |
OMF Price Returns
| 1-mo | 10.56% |
| 3-mo | 6.47% |
| 6-mo | 13.45% |
| 1-year | 28.14% |
| 3-year | 19.70% |
| 5-year | 179.53% |
| YTD | 12.48% |
| 2023 | 63.03% |
| 2022 | -27.20% |
| 2021 | 23.56% |
| 2020 | 34.53% |
| 2019 | 88.37% |
OMF Dividends
| Ex-Dividend Date | Type | Payout Amount | Change | ||||||
|---|---|---|---|---|---|---|---|---|---|
| Loading, please wait... | |||||||||
Continue Researching OMF
Want to do more research on OneMain Holdings Inc's stock and its price? Try the links below:OneMain Holdings Inc (OMF) Stock Price | Nasdaq
OneMain Holdings Inc (OMF) Stock Quote, History and News - Yahoo Finance
OneMain Holdings Inc (OMF) Stock Price and Basic Information | MarketWatch
Loading social stream, please wait...