Owens & Minor, Inc. (OMI): Price and Financial Metrics
OMI Stock Summary
- The capital turnover (annual revenue relative to shareholder's equity) for OMI is 11.91 -- better than 97.39% of US stocks.
- With a price/sales ratio of 0.28, Owens & Minor Inc has a higher such ratio than just 4.86% of stocks in our set.
- In terms of twelve month growth in earnings before interest and taxes, Owens & Minor Inc is reporting a growth rate of 356.32%; that's higher than 95.42% of US stocks.
- Stocks that are quantitatively similar to OMI, based on their financial statements, market capitalization, and price volatility, are INT, LMB, ONEW, VRTV, and ALTG.
- OMI's SEC filings can be seen here. And to visit Owens & Minor Inc's official web site, go to www.owens-minor.com.
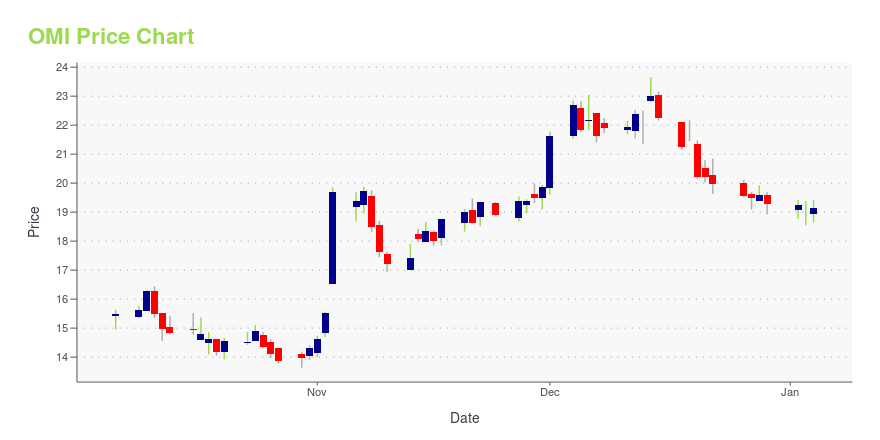
OMI Stock Price Chart Interactive Chart >
OMI Price/Volume Stats
Current price | $34.01 | 52-week high | $35.73 |
Prev. close | $32.50 | 52-week low | $3.63 |
Day low | $32.50 | Volume | 1,434,400 |
Day high | $34.70 | Avg. volume | 1,446,763 |
50-day MA | $28.66 | Dividend yield | 0.03% |
200-day MA | $19.62 | Market Cap | 2.50B |
Owens & Minor, Inc. (OMI) Company Bio
Owens & Minor provides supply chain assistance to the providers of healthcare services and the manufacturers of healthcare products, supplies and devices. The Company operates in two segments: Domestic and International. The company was founded in 1882 and is based in Mechanicsville, Virginia.
OMI Price Forecast Based on DCF Valuation
Current Price | DCF Fair Value Target: | Forecasted Gain: |
$34.01 | $1047.43 | 3123% |
Below please find a table outlining a discounted cash flow forecast for OMI, in which we model out valuation assuming a variety of terminal growth rates. To summarize, we found that Owens & Minor Inc ranked in the 95th percentile in terms of potential gain offered. Specifically, our DCF analysis implies the stock is trading below its fair value by an estimated 3138.67%. As for the metrics that stood out in our discounted cash flow analysis of Owens & Minor Inc, consider:
- The stock's equity weight, or the proportion of capital from equity relative to debt, is 68. Notably, its equity weight is greater than merely 18.55% of US equities in the Healthcare sector yielding a positive free cash flow.
- The company's compound free cash flow growth rate over the past 5.83 years comes in at 1.1%; that's greater than 91.16% of US stocks we're applying DCF forecasting to.
- The business' balance sheet reveals debt to be 32% of the company's capital (with equity being the remaining amount). Approximately 65.01% of US stocks with free cash flow have a lower reliance on debt in their capital structure.
Terminal Growth Rate in Free Cash Flow | Return Relative to Current Share Price |
0% | 3060% |
1% | 3091% |
2% | 3123% |
3% | 3154% |
4% | 3186% |
5% | 3218% |
For other companies in the Healthcare that have a similar discounted cashflow valuation profile (and ensuing price forecasts) as OMI, try RDY, CYH, SSY, ALPN, and MNKKQ.
Latest OMI News From Around the Web
Below are the latest news stories about Owens & Minor Inc that investors may wish to consider to help them evaluate OMI as an investment opportunity.
Owens & Minor Medical, Inc. -- Moody's announces completion of a periodic review of ratings of Owens & Minor, Inc.Announcement of Periodic Review: Moody's announces completion of a periodic review of ratings of Owens & Minor, Inc.Global Credit Research - 25 Feb 2021New York, February 25, 2021 -- Moody's Investors Service ("Moody's") has completed a periodic review of the ratings of Owens & Minor, Inc. and other ratings that are associated with the same analytical unit. The review was conducted through a portfolio review discussion held on 23 February 2021 in which Moody's reassessed the appropriateness of the ratings in the context of the relevant principal methodology(ies), recent developments, and a comparison of the financial and operating profile to similarly rated peers. |
Owens & Minor, Inc. (OMI) CEO Ed Pesicka on Q4 2020 Results - Earnings Call TranscriptOwens & Minor, Inc. (OMI) Q4 2020 Results Earnings Conference Call February 24, 2021, 8:30 AM ET Company Participants Chandrika Nigam - Director, Investor Relations Ed Pesicka - President and CEO Andy Long - Executive Vice President and CFO Conference Call Participants Michael Cherny - Bank of America Kevin Caliendo... |
Owens & Minor, Inc. 2020 Q4 - Results - Earnings Call PresentationThe following slide deck was published by Owens & Minor, Inc. in conjunction with their 2020 Q4 earnings call.... |
Two New Members Elected to Owens & Minor Board of DirectorsRICHMOND, Va.--(BUSINESS WIRE)-- #boardofdirectors--Press release of new board members, for distro after Earnings release, before 7am |
Owens & Minor Reports Record 4th Quarter and Full Year 2020 Earnings ResultsRICHMOND, Va.--(BUSINESS WIRE)-- #2020earnings--Owens & Minor Reports Record 4th Quarter and Full Year 2020 Earnings Results |
OMI Price Returns
1-mo | 16.95% |
3-mo | 31.63% |
6-mo | 96.52% |
1-year | 398.43% |
3-year | 117.73% |
5-year | -2.25% |
YTD | 25.73% |
2020 | 423.71% |
2019 | -18.18% |
2018 | -64.51% |
2017 | -44.45% |
2016 | 0.88% |
OMI Dividends
Ex-Dividend Date | Type | Payout Amount | Change | ||||||
---|---|---|---|---|---|---|---|---|---|
Loading, please wait... |
Continue Researching OMI
Here are a few links from around the web to help you further your research on Owens & Minor Inc's stock as an investment opportunity:Owens & Minor Inc (OMI) Stock Price | Nasdaq
Owens & Minor Inc (OMI) Stock Quote, History and News - Yahoo Finance
Owens & Minor Inc (OMI) Stock Price and Basic Information | MarketWatch
Get Free Updates
Join thousands of investors who get the latest news, insights and top rated picks from StockNews.com!
Loading social stream, please wait...