ON Semiconductor Corp. (ON): Price and Financial Metrics

ON Semiconductor Corp. (ON): $73.55

2.06 (-2.72%)

POWR Rating

Component Grades

Momentum

C

Stability

D

Sentiment

Quality

C

ON Price/Volume Stats
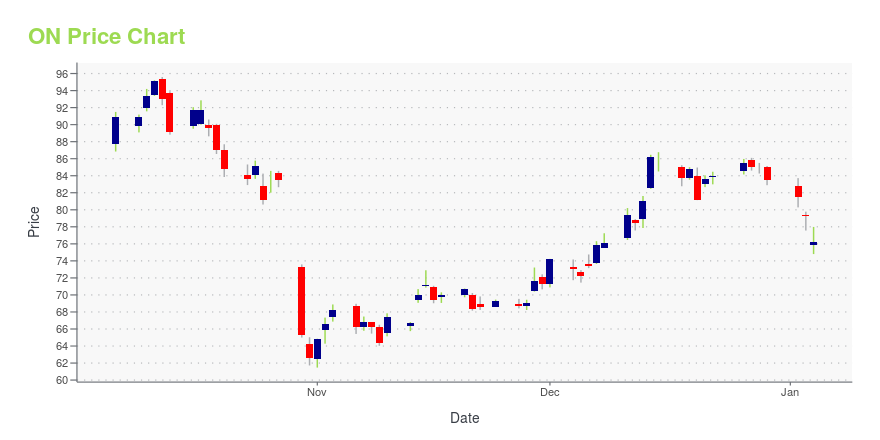
Current price $73.55 52-week high $111.35
Prev. close $75.61 52-week low $61.47
Day low $73.38 Volume 7,408,800
Day high $76.08 Avg. volume 7,527,282
50-day MA $76.64 Dividend yield N/A
200-day MA $84.59 Market Cap 31.68B

ON Stock Price Chart Interactive Chart >

ON POWR Grades

  • Momentum is the dimension where ON ranks best; there it ranks ahead of 86.94% of US stocks.
  • The strongest trend for ON is in Stability, which has been heading down over the past 26 weeks.
  • ON ranks lowest in Growth; there it ranks in the 4th percentile.

ON Stock Summary

  • ON has a market capitalization of $34,158,625,625 -- more than approximately 92.5% of US stocks.
  • Of note is the ratio of ON SEMICONDUCTOR CORP's sales and general administrative expense to its total operating expenses; 25.67% of US stocks have a lower such ratio.
  • In terms of twelve month growth in earnings before interest and taxes, ON SEMICONDUCTOR CORP is reporting a growth rate of 28.26%; that's higher than 74.88% of US stocks.
  • Stocks with similar financial metrics, market capitalization, and price volatility to ON SEMICONDUCTOR CORP are BIIB, TER, GRMN, KEYS, and JNPR.
  • ON's SEC filings can be seen here. And to visit ON SEMICONDUCTOR CORP's official web site, go to www.onsemi.com.

ON Valuation Summary

  • In comparison to the median Technology stock, ON's price/sales ratio is 62.5% higher, now standing at 3.9.
  • Over the past 243 months, ON's price/sales ratio has gone up 2.6.

Below are key valuation metrics over time for ON.

Stock Date P/S P/B P/E EV/EBIT
ON 2023-12-08 3.9 4.4 14.7 12.1
ON 2023-12-07 3.9 4.4 14.7 12.1
ON 2023-12-06 3.8 4.2 14.2 11.7
ON 2023-12-05 3.7 4.2 14.0 11.5
ON 2023-12-04 3.8 4.2 14.1 11.6
ON 2023-12-01 3.8 4.3 14.3 11.8

ON Growth Metrics

    Its year over year cash and equivalents growth rate is now at 57.8%.
  • The year over year net cashflow from operations growth rate now stands at 117.99%.
  • Its year over year price growth rate is now at 48.04%.
ON's revenue has moved up $2,917,000,000 over the prior 34 months.

The table below shows ON's growth in key financial areas (numbers in millions of US dollars).

Date Revenue Operating Cash Flow Net Income to Common Stock
2022-12-31 8,326.2 2,633.1 1,904.2
2022-09-30 8,068.7 2,528.4 1,725.3
2022-06-30 7,618.2 1,974.9 1,722.6
2022-03-31 7,203.1 2,042.1 1,450.4
2021-12-31 6,739.8 1,782 1,009.6
2021-09-30 6,340 1,555.8 672.7

ON's Quality Factors

The “Quality” component of the POWR Ratings focuses on 31 different factors of a companies fundamentals and operational strength. Here are some key insights as we drill into the specifics of these quality attributes.
  • ON has a Quality Grade of C, ranking ahead of 60.53% of graded US stocks.
  • ON's asset turnover comes in at 0.728 -- ranking 100th of 208 Electronic Equipment stocks.
  • AVGO, CTS, and AXTI are the stocks whose asset turnover ratios are most correlated with ON.

The table below shows ON's key quality metrics over time.

Period Asset Turnover Gross Margin ROIC
2021-10-01 0.728 0.375 0.133
2021-07-02 0.673 0.355 0.091
2021-04-02 0.605 0.336 0.059
2020-12-31 0.570 0.327 0.043
2020-10-02 0.569 0.327 0.039
2020-07-03 0.588 0.329 0.019

ON Price Target

For more insight on analysts targets of ON, see our ON price target page. And for a list of of all stocks sorted by upside potential based on analyst target price, see our Top Price Target page.

Average Price Target $53.63 Average Broker Recommendation 1.57 (Moderate Buy)

ON Semiconductor Corp. (ON) Company Bio


onsemi (stylized in lowercase; legally ON Semiconductor Corporation; formerly ON Semiconductor until August 5, 2021) is an American semiconductor supplier company, based in Phoenix, Arizona and ranked #483 on the 2022 Fortune 500 based on its 2021 sales. Products include power and signal management, logic, discrete, and custom devices for automotive, communications, computing, consumer, industrial, LED lighting, medical, military/aerospace and power applications. onsemi runs a network of manufacturing facilities, sales offices and design centers in North America, Europe, and the Asia Pacific regions. Based on its 2016 revenues of $3.907 billion, onsemi ranked among the worldwide top 20 semiconductor sales leaders. (Source:Wikipedia)


ON Latest News Stream


Event/Time News Detail
Loading, please wait...

ON Latest Social Stream


Loading social stream, please wait...

View Full ON Social Stream

Latest ON News From Around the Web

Below are the latest news stories about ON SEMICONDUCTOR CORP that investors may wish to consider to help them evaluate ON as an investment opportunity.

Plug Into Profits: 3 EV Charging Stocks to Buy as 2023 Ends

With 2023 coming to an end, investors have the opportunity to plug into the power of the best EV charging stocks to buy.

Terel Miles on InvestorPlace | December 26, 2023

3 Semiconductor Stocks You’ll Regret Not Buying Soon: December Edition

Semiconductor stocks are set for a record 2024 as the industry is set to begin posting 20% CAGR amid renewed sector enthusiasm

Jeremy Flint on InvestorPlace | December 25, 2023

3 Red Hot Megatrends to Invest in for 2024

AI captured the spotlight in 2023, but don't be surprised if other trends pop up on Wall Street's radar in 2024.

Yahoo | December 24, 2023

Best Flying Cars Stocks 2024: 3 Names to Add to Your Must-Buy List

Companies all over the world are fighting for a piece of what could be a potential $1.5 trillion opportunity with flying car stocks.

Ian Cooper on InvestorPlace | December 22, 2023

ON Semiconductor Corp. (ON) Beats Stock Market Upswing: What Investors Need to Know

ON Semiconductor Corp. (ON) reachead $84.74 at the closing of the latest trading day, reflecting a +1.17% change compared to its last close.

Yahoo | December 19, 2023

Read More 'ON' Stories Here

ON Price Returns

1-mo -3.82%
3-mo -11.95%
6-mo -20.87%
1-year -10.12%
3-year 84.47%
5-year 257.56%
YTD -11.95%
2023 33.93%
2022 -8.17%
2021 107.52%
2020 34.25%
2019 47.67%

Get Free Updates

Join thousands of investors who get the latest news, insights and top rated picks from StockNews.com!