Onto Innovation (ONTO): Price and Financial Metrics
GET POWR RATINGS... FREE!
ONTO POWR Grades
- Sentiment is the dimension where ONTO ranks best; there it ranks ahead of 88.29% of US stocks.
- The strongest trend for ONTO is in Growth, which has been heading down over the past 179 days.
- ONTO's current lowest rank is in the Value metric (where it is better than 41.15% of US stocks).
ONTO Stock Summary
- The ratio of debt to operating expenses for ONTO INNOVATION INC is higher than it is for about just 0.48% of US stocks.
- ONTO's equity multiplier -- a measure of assets relative to shareholders'equity -- is greater than that of only 11.42% of US stocks.
- In terms of twelve month growth in earnings before interest and taxes, ONTO INNOVATION INC is reporting a growth rate of 88.16%; that's higher than 84.44% of US stocks.
- Stocks with similar financial metrics, market capitalization, and price volatility to ONTO INNOVATION INC are DOX, EBS, COHU, VMAR, and IPA.
- ONTO's SEC filings can be seen here. And to visit ONTO INNOVATION INC's official web site, go to www.ontoinnovation.com.
ONTO Valuation Summary
- In comparison to the median Technology stock, ONTO's price/earnings ratio is 28.02% lower, now standing at 18.5.
- Over the past 243 months, ONTO's price/sales ratio has gone up 2.2.
Below are key valuation metrics over time for ONTO.
Stock | Date | P/S | P/B | P/E | EV/EBIT |
---|---|---|---|---|---|
ONTO | 2023-01-20 | 3.9 | 2.4 | 18.5 | 15.8 |
ONTO | 2023-01-19 | 3.7 | 2.3 | 18.0 | 15.3 |
ONTO | 2023-01-18 | 3.9 | 2.4 | 18.5 | 15.8 |
ONTO | 2023-01-17 | 3.9 | 2.4 | 18.7 | 16.0 |
ONTO | 2023-01-13 | 3.9 | 2.4 | 18.8 | 16.1 |
ONTO | 2023-01-12 | 3.9 | 2.5 | 18.9 | 16.2 |
ONTO Growth Metrics
- Its 3 year cash and equivalents growth rate is now at 81.14%.
- Its 4 year net income to common stockholders growth rate is now at -111.91%.
- The 5 year net cashflow from operations growth rate now stands at -42.19%.

The table below shows ONTO's growth in key financial areas (numbers in millions of US dollars).
Date | Revenue | Operating Cash Flow | Net Income to Common Stock |
---|---|---|---|
2022-09-30 | 977.557 | 136.209 | 203.857 |
2022-06-30 | 923.893 | 154.241 | 188.09 |
2022-03-31 | 860.97 | 169.738 | 171.566 |
2021-12-31 | 788.899 | 175.281 | 142.349 |
2021-09-30 | 718.383 | 159.405 | 115.526 |
2021-06-30 | 644.286 | 135.541 | 87.169 |
ONTO's Quality Factors
The “Quality” component of the POWR Ratings focuses on 31 different factors of a companies fundamentals and operational strength. Here are some key insights as we drill into the specifics of these quality attributes.- ONTO has a Quality Grade of B, ranking ahead of 76.15% of graded US stocks.
- ONTO's asset turnover comes in at 0.433 -- ranking 53rd of 75 Measuring and Control Equipment stocks.
- HURC, TER, and BRKR are the stocks whose asset turnover ratios are most correlated with ONTO.
The table below shows ONTO's key quality metrics over time.
Period | Asset Turnover | Gross Margin | ROIC |
---|---|---|---|
2021-06-26 | 0.433 | 0.528 | 0.140 |
2021-03-27 | 0.403 | 0.523 | 0.098 |
2020-12-26 | 0.388 | 0.500 | 0.047 |
2020-09-26 | 0.350 | 0.462 | -0.005 |
2020-06-27 | 0.381 | 0.449 | -0.011 |
2020-03-28 | 0.415 | 0.433 | -0.021 |
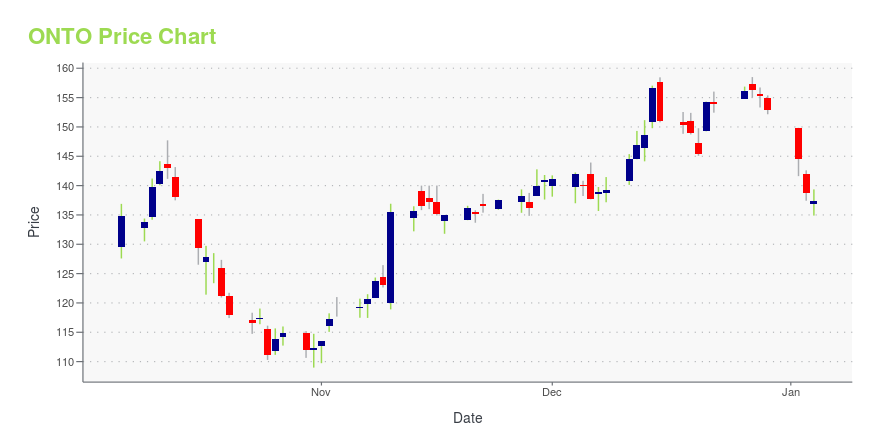
ONTO Stock Price Chart Interactive Chart >
ONTO Price/Volume Stats
Current price | $80.51 | 52-week high | $97.93 |
Prev. close | $78.64 | 52-week low | $56.02 |
Day low | $77.85 | Volume | 171,712 |
Day high | $80.51 | Avg. volume | 176,718 |
50-day MA | $75.53 | Dividend yield | N/A |
200-day MA | $73.14 | Market Cap | 3.99B |
Onto Innovation (ONTO) Company Bio
Onto Innovation (Combination of Nanometrics and Rudolph Technologies) engages in design, development, manufacture and support of defect inspection, lithography, process control metrology, and data analysis systems and software used by semiconductor and advanced packaging device manufacturers worldwide. The company was founded in 1940 and is based in Flanders, New Jersey.
Latest ONTO News From Around the Web
Below are the latest news stories about ONTO INNOVATION INC that investors may wish to consider to help them evaluate ONTO as an investment opportunity.
Onto Innovation Welcomes Stephen D. Kelley to its Board of DirectorsWILMINGTON, Mass., January 24, 2023--Onto Innovation Inc. (NYSE: ONTO) ("Onto Innovation", "Onto", or the "Company") today announced Stephen D. Kelley has joined its board of directors. |
Is Onto Innovation Inc. (NYSE:ONTO) Potentially Undervalued?Onto Innovation Inc. ( NYSE:ONTO ), might not be a large cap stock, but it saw a significant share price rise of over... |
Onto Innovation to Report Fourth Quarter and Full Year 2022 Financial Results on February 9, 2023WILMINGTON, Mass., January 12, 2023--Onto Innovation Inc. (NYSE: ONTO) will release its 2022 fourth quarter and full year financial results shortly after the market closes on Thursday, February 9, 2023. Onto Innovation will host a conference call and audio webcast in connection with its release of the financial results. Michael P. Plisinski, chief executive officer, and Mark Slicer, chief financial officer, will host the call. The call will take place: |
Is this the Best Time to Add Onto Innovation (ONTO) to Your Portfolio?TimesSquare Capital Management, an equity investment management company, released its “U.S. Small/Mid Cap Growth Strategy” third-quarter investor letter. A copy of the same can be downloaded here. In the third quarter, the strategy outperformed the Russell 2500 Growth Index and returned 0.22% (net), and the index return was -0.12%. During the quarter, weakness in Financials, Health […] |
Onto Innovation to Participate in 25th Annual Needham Growth ConferenceWILMINGTON, Mass., December 21, 2022--Onto Innovation Inc. (NYSE: ONTO) ("Onto Innovation," "Onto," or the "Company") today announced that Michael Plisinski, chief executive officer, and Mark Slicer, chief financial officer, will participate in the upcoming 25th Annual Needham Growth Conference, taking place at the Lotte New York Palace Hotel on January 10-11, 2023. |
ONTO Price Returns
1-mo | 19.99% |
3-mo | 19.82% |
6-mo | -3.29% |
1-year | -9.45% |
3-year | 111.76% |
5-year | 206.35% |
YTD | 18.24% |
2022 | -32.74% |
2021 | 112.89% |
2020 | 30.13% |
2019 | 33.70% |
2018 | 9.67% |
Loading social stream, please wait...