Option Care Health, Inc. (OPCH): Price and Financial Metrics
GET POWR RATINGS... FREE!
OPCH POWR Grades
- Growth is the dimension where OPCH ranks best; there it ranks ahead of 99.93% of US stocks.
- OPCH's strongest trending metric is Growth; it's been moving up over the last 179 days.
- OPCH ranks lowest in Momentum; there it ranks in the 17th percentile.
OPCH Stock Summary
- Option Care Health Inc's capital turnover -- a measure of revenue relative to shareholder's equity -- is better than 83.25% of US listed stocks.
- OPCH's current price/earnings ratio is 36.88, which is higher than 78.25% of US stocks with positive earnings.
- Over the past twelve months, OPCH has reported earnings growth of 78.97%, putting it ahead of 76.61% of US stocks in our set.
- If you're looking for stocks that are quantitatively similar to Option Care Health Inc, a group of peers worth examining would be VRT, BECN, IVC, GMS, and WCC.
- OPCH's SEC filings can be seen here. And to visit Option Care Health Inc's official web site, go to www.optioncarehealth.com.
OPCH Valuation Summary
- OPCH's price/earnings ratio is 99.3; this is 172.05% higher than that of the median Healthcare stock.
- Over the past 243 months, OPCH's price/sales ratio has gone up 0.9.
- Over the past 243 months, OPCH's EV/EBIT ratio has gone down 20.6.
Below are key valuation metrics over time for OPCH.
Stock | Date | P/S | P/B | P/E | EV/EBIT |
---|---|---|---|---|---|
OPCH | 2021-08-31 | 1.5 | 4.6 | 99.3 | 42.9 |
OPCH | 2021-08-30 | 1.5 | 4.5 | 97.5 | 42.3 |
OPCH | 2021-08-27 | 1.4 | 4.3 | 93.0 | 40.7 |
OPCH | 2021-08-26 | 1.5 | 4.4 | 96.5 | 41.9 |
OPCH | 2021-08-25 | 1.4 | 4.4 | 95.8 | 41.7 |
OPCH | 2021-08-24 | 1.4 | 4.1 | 89.6 | 39.5 |
OPCH Growth Metrics
- Its 5 year revenue growth rate is now at 125.21%.
- Its 4 year price growth rate is now at 15.88%.
- Its 4 year net income to common stockholders growth rate is now at 67.58%.

The table below shows OPCH's growth in key financial areas (numbers in millions of US dollars).
Date | Revenue | Operating Cash Flow | Net Income to Common Stock |
---|---|---|---|
2021-12-31 | 3,438.64 | 208.569 | 139.898 |
2021-09-30 | 3,316.159 | 168.923 | 82.27 |
2021-06-30 | 3,205.831 | 166.036 | 48.457 |
2021-03-31 | 3,086.407 | 127.369 | 8.973 |
2020-12-31 | 3,032.61 | 127.392 | -8.076 |
2020-09-30 | 2,948.676 | 124.625 | -41.726 |
OPCH's Quality Factors
The “Quality” component of the POWR Ratings focuses on 31 different factors of a companies fundamentals and operational strength. Here are some key insights as we drill into the specifics of these quality attributes.- OPCH has a Quality Grade of C, ranking ahead of 63.98% of graded US stocks.
- OPCH's asset turnover comes in at 1.201 -- ranking 15th of 81 Healthcare stocks.
- THC, HCA, and EHC are the stocks whose asset turnover ratios are most correlated with OPCH.
The table below shows OPCH's key quality metrics over time.
Period | Asset Turnover | Gross Margin | ROIC |
---|---|---|---|
2021-06-30 | 1.201 | 0.225 | 0.088 |
2021-03-31 | 1.167 | 0.223 | 0.070 |
2020-12-31 | 1.149 | 0.225 | 0.063 |
2020-09-30 | 1.124 | 0.229 | 0.045 |
2020-06-30 | 1.069 | 0.229 | 0.018 |
2020-03-31 | 1.066 | 0.240 | 0.004 |
OPCH Price Target
For more insight on analysts targets of OPCH, see our OPCH price target page. And for a list of of all stocks sorted by upside potential based on analyst target price, see our Top Price Target page.
Average Price Target | $27.94 | Average Broker Recommendation | 1.28 (Strong Buy) |
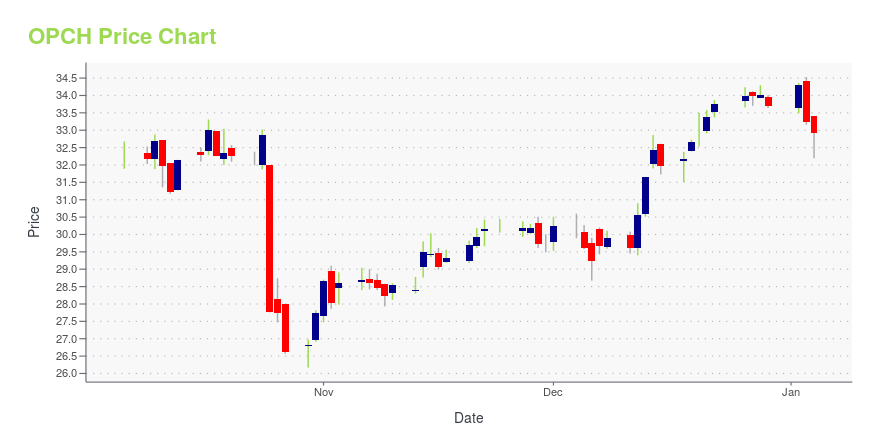
OPCH Stock Price Chart Interactive Chart >
OPCH Price/Volume Stats
Current price | $29.07 | 52-week high | $30.70 |
Prev. close | $28.56 | 52-week low | $17.97 |
Day low | $27.68 | Volume | 551,600 |
Day high | $29.28 | Avg. volume | 791,696 |
50-day MA | $28.31 | Dividend yield | N/A |
200-day MA | $26.11 | Market Cap | 5.23B |
Option Care Health, Inc. (OPCH) Company Bio
Option Care Health, Inc. provides infusion and home care management solutions. The Company offers products, services, and condition-specific clinical management programs for gastrointestinal abnormalities, infectious diseases, cancer, organ and blood cell transplants, bleeding disorders, and heart failures. Option Care Health serves patients in the United States.
Latest OPCH News From Around the Web
Below are the latest news stories about Option Care Health Inc that investors may wish to consider to help them evaluate OPCH as an investment opportunity.
Option Care Health's (OPCH) CEO John Rademacher on Q4 2021 Results - Earnings Call TranscriptOption Care Health, Inc. (OPCH) Q4 2021 Earnings Conference Call February 23, 2022 8:30 AM ET Company Participants Mike Shapiro – Chief Financial Officer and Senior Vice President John Rademacher – Chief Executive Officer Conference Call Participants David Macdonald – Truist Joanna Gajuk – Bank of America Pito Chickering –... |
Option Care (OPCH) Q4 Earnings Meet EstimatesOption Care (OPCH) delivered earnings and revenue surprises of 0% and 0.80%, respectively, for the quarter ended December 2021. Do the numbers hold clues to what lies ahead for the stock? |
Option Care Health Reports Financial Results for Fourth Quarter and Full Year 2021 and Announces Two Additional AcquisitionsBANNOCKBURN, Ill., Feb. 23, 2022 (GLOBE NEWSWIRE) -- Option Care Health, Inc. (the “Company” or “Option Care Health”) (Nasdaq: OPCH), the nation’s largest independent provider of home and alternate site infusion services, announced today financial results for the fourth quarter and full year ended December 31, 2021. The Company also announced that it acquired Wasatch Infusion LLC ("Wasatch"), an infusion center operator based in Salt Lake City, Utah, in December and has also entered into a defin |
Option Care Health Q4 2021 Earnings PreviewOption Care Health (NASDAQ:OPCH) is scheduled to announce Q4 earnings results on Wednesday, February 23rd, before market open. The consensus EPS Estimate is $0.24 (+140.0% Y/Y) and the consensus Revenue Estimate is $917.68M (+14.0% Y/Y). Over the last 1 year, OPCH has beaten EPS estimates 25% of the time and... |
How Did Hedge Funds’ Option Care Health, Inc. (OPCH) Bets Fare?The latest 13F reporting period has come and gone, and Insider Monkey is again at the forefront when it comes to making use of this gold mine of data. We at Insider Monkey have plowed through 867 13F filings that hedge funds and well-known value investors are required to file by the SEC. The 13F […] |
OPCH Price Returns
1-mo | 7.35% |
3-mo | 13.47% |
6-mo | 13.47% |
1-year | 51.41% |
3-year | 254.51% |
5-year | 312.93% |
YTD | 2.22% |
2021 | 81.84% |
2020 | 4.83% |
2019 | 4.48% |
2018 | 22.68% |
2017 | 179.81% |
Loading social stream, please wait...