
OppFi Inc. (OPFI): Price and Financial Metrics
OPFI Price/Volume Stats
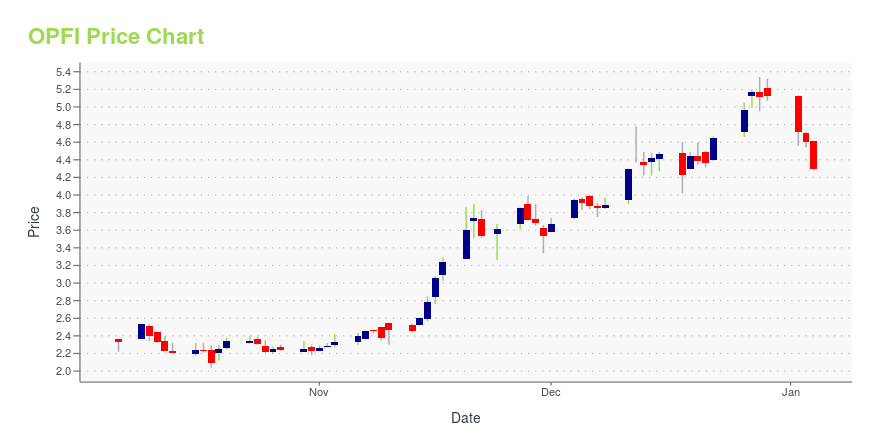
| Current price | $4.17 | 52-week high | $5.34 |
| Prev. close | $3.99 | 52-week low | $1.95 |
| Day low | $3.96 | Volume | 140,800 |
| Day high | $4.19 | Avg. volume | 274,220 |
| 50-day MA | $3.45 | Dividend yield | N/A |
| 200-day MA | $3.28 | Market Cap | 463.95M |
OPFI Stock Price Chart Interactive Chart >
OppFi Inc. (OPFI) Company Bio
OppFi Inc. operates as a financial technology platform. It facilitates the issuance of loans. The company is based in Chicago, Illinois.
Latest OPFI News From Around the Web
Below are the latest news stories about OPPFI INC that investors may wish to consider to help them evaluate OPFI as an investment opportunity.
7 Micro-Cap Stocks for Risk-Tolerant Investors to Buy in 2024Whether you’re looking at automotive stocks, financial stocks, tech stocks, value or growth, or the hottest trend of artificial intelligence, there’s something for every investing palate. |
Why These 7 Fintech Stocks Should Be on Your Radar in 2024Consider adding these seven fintech stocks to your watchlist, as each one is poised to profit from the "future of finance" trend. |
7 Under-$10 Names to Put in Your Christmas StockingStocks under $10 can serve as a memorable and potentially profitable addition to your Christmas stocking while diversifying your holdings. |
OppFi Reports Third Quarter 2023 Results, Raises Full-Year Earnings OutlookCHICAGO, November 09, 2023--OppFi Inc. (NYSE: OPFI; OPFI WS) ("OppFi" or the "Company"), a tech-enabled, mission-driven specialty finance platform that broadens the reach of community banks to extend credit access to everyday Americans, today reported financial results for the third quarter ended September 30, 2023. |
OppFi Provides Business Update, Announces Participation in the ThinkEquity Conference, and Schedules Third Quarter 2023 Earnings Conference CallCHICAGO, October 18, 2023--OppFi Inc. (NYSE: OPFI; OPFI WS) ("OppFi" or the "Company"), a mission-driven fintech platform that helps everyday Americans gain access to credit with digital specialty finance products, today provided a business update, announced its participation in the ThinkEquity Conference, and scheduled its third quarter 2023 earnings conference call for after the market-close on Thursday, November 9, 2023. |
OPFI Price Returns
| 1-mo | 23.01% |
| 3-mo | 56.77% |
| 6-mo | 21.93% |
| 1-year | 106.44% |
| 3-year | -59.94% |
| 5-year | N/A |
| YTD | -18.55% |
| 2023 | 149.76% |
| 2022 | -54.85% |
| 2021 | -55.40% |
| 2020 | N/A |
| 2019 | N/A |
Loading social stream, please wait...