OpGen, Inc. (OPGN): Price and Financial Metrics

OpGen, Inc. (OPGN): $0.22

0.01 (-2.31%)

POWR Rating

Component Grades

Momentum

D

Stability

F

Sentiment

Quality

D

OPGN Price/Volume Stats

Current price $0.22 52-week high $9.05
Prev. close $0.22 52-week low $0.17
Day low $0.21 Volume 127,700
Day high $0.23 Avg. volume 373,846
50-day MA $0.34 Dividend yield N/A
200-day MA $1.12 Market Cap 1.96M

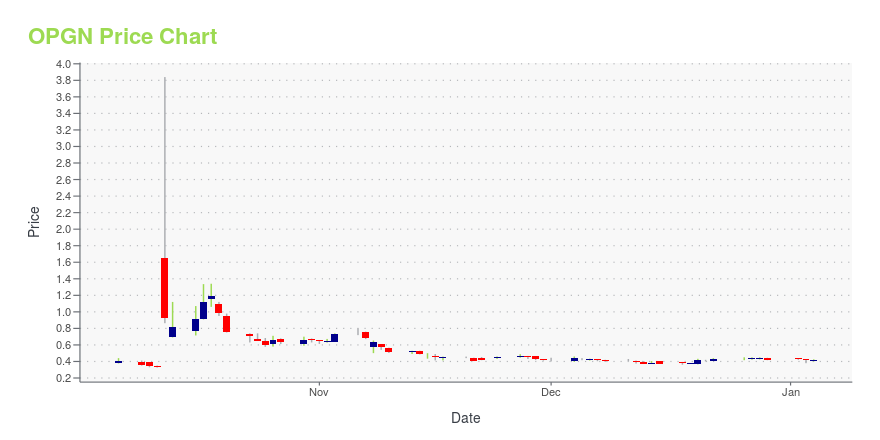
OPGN Stock Price Chart Interactive Chart >

OPGN POWR Grades

  • Growth is the dimension where OPGN ranks best; there it ranks ahead of 92.97% of US stocks.
  • OPGN's strongest trending metric is Sentiment; it's been moving up over the last 99 days.
  • OPGN ranks lowest in Stability; there it ranks in the 0th percentile.

OPGN Stock Summary

  • With a market capitalization of $2,037,991, OPGEN INC has a greater market value than merely 0.74% of US stocks.
  • The volatility of OPGEN INC's share price is greater than that of 95.77% US stocks with at least 200 days of trading history.
  • OPGEN INC's shareholder yield -- a measure of how much capital is returned to stockholders via dividends and buybacks -- is -312.07%, greater than the shareholder yield of just 2.1% of stocks in our set.
  • Stocks with similar financial metrics, market capitalization, and price volatility to OPGEN INC are EBS, REKR, TELL, BB, and AGS.
  • Visit OPGN's SEC page to see the company's official filings. To visit the company's web site, go to www.opgen.com.

OPGN Valuation Summary

  • In comparison to the median Healthcare stock, OPGN's EV/EBIT ratio is 102.59% lower, now standing at -0.3.
  • Over the past 102 months, OPGN's price/sales ratio has gone down 11.9.

Below are key valuation metrics over time for OPGN.

Stock Date P/S P/B P/E EV/EBIT
OPGN 2023-09-22 0.7 0.3 -0.1 -0.3
OPGN 2023-09-21 0.7 0.3 -0.1 -0.3
OPGN 2023-09-20 0.8 0.3 -0.1 -0.3
OPGN 2023-09-19 0.8 0.3 -0.1 -0.3
OPGN 2023-09-18 0.7 0.3 -0.1 -0.3
OPGN 2023-09-15 0.7 0.3 -0.1 -0.3

OPGN Growth Metrics

    Its 5 year price growth rate is now at -99.58%.
  • Its 4 year cash and equivalents growth rate is now at 586.67%.
  • Its 3 year revenue growth rate is now at 26.47%.
OPGN's revenue has moved up $132,971 over the prior 49 months.

The table below shows OPGN's growth in key financial areas (numbers in millions of US dollars).

Date Revenue Operating Cash Flow Net Income to Common Stock
2022-09-30 3.311231 -20.24373 -40.72673
2022-06-30 4.10165 -20.62097 -32.67944
2022-03-31 3.94606 -21.55475 -33.92559
2021-12-31 4.306031 -21.47928 -41.97246
2021-09-30 4.232821 -24.62876 -35.10417
2021-06-30 4.050454 -26.723 -36.72306

OPGN's Quality Factors

The “Quality” component of the POWR Ratings focuses on 31 different factors of a companies fundamentals and operational strength. Here are some key insights as we drill into the specifics of these quality attributes.
  • OPGN has a Quality Grade of D, ranking ahead of 6.34% of graded US stocks.
  • OPGN's asset turnover comes in at 0.068 -- ranking 75th of 81 Healthcare stocks.
  • PMD, MGLN, and THC are the stocks whose asset turnover ratios are most correlated with OPGN.

The table below shows OPGN's key quality metrics over time.

Period Asset Turnover Gross Margin ROIC
2021-06-30 0.068 0.109 -1.125
2021-03-31 0.082 0.075 -1.281
2020-12-31 0.105 0.087 -1.177
2020-09-30 0.122 0.118 -1.429
2020-06-30 0.158 0.329 -1.982
2020-03-31 0.272 0.457 -3.454

OPGN Price Target

For more insight on analysts targets of OPGN, see our OPGN price target page. And for a list of of all stocks sorted by upside potential based on analyst target price, see our Top Price Target page.

Average Price Target $5.00 Average Broker Recommendation 1.5 (Moderate Buy)


OPGN Latest News Stream


Event/Time News Detail
Loading, please wait...

OPGN Latest Social Stream


Loading social stream, please wait...

View Full OPGN Social Stream

Latest OPGN News From Around the Web

Below are the latest news stories about OPGEN INC that investors may wish to consider to help them evaluate OPGN as an investment opportunity.

Today’s Biggest Pre-Market Stock Movers: 10 Top Gainers and Losers on Monday

We're starting the week off right with a breakdown of the biggest pre-market stock movers worth knowing about on Monday morning!

William White on InvestorPlace | August 14, 2023

OpGen, Inc. (NASDAQ:OPGN) Q2 2023 Earnings Call Transcript

OpGen, Inc. (NASDAQ:OPGN) Q2 2023 Earnings Call Transcript August 10, 2023 OpGen, Inc. misses on earnings expectations. Reported EPS is $-0.93 EPS, expectations were $-0.71. Operator: Welcome to OpGen’s Second Quarter 2023 Earnings Call and Business Update. Before we turn the call over to OpGen management, please note that any forward-looking statements made during this […]

Yahoo | August 13, 2023

Q2 2023 OpGen Inc Earnings Call

Q2 2023 OpGen Inc Earnings Call

Yahoo | August 11, 2023

OpGen Reports Second Quarter 2023 Financial Results and Provides Business Update

Total revenue for the first half of 2023 was approximately $1.65 million, an increase of approximately 15% compared to approximately $1.44 million in the first half of 2022Signed FIND R&D collaboration contract extensionEntered distribution agreement with Fisher Healthcare for the distribution of the Unyvero A50 platform in the U.S.Management conference call is scheduled for August 10, 2023, at 4:30 p.m. ET ROCKVILLE, Md., Aug. 10, 2023 (GLOBE NEWSWIRE) -- OpGen, Inc. (Nasdaq: OPGN, “OpGen” or “

Yahoo | August 10, 2023

OpGen’s Subsidiary Ares Genetics Releases New Features to its AREScloud Offering

Single nucleotide polymorphism (SNP) analysis module and interpretation of plasmids now availableAdded reporting customized for the needs of hospital epidemiologists Signed first large commercial contract with U.S. healthcare network using the new features ROCKVILLE, Md., Aug. 07, 2023 (GLOBE NEWSWIRE) -- OpGen, Inc. (Nasdaq: OPGN, “OpGen”), a precision medicine company harnessing the power of molecular diagnostics and informatics to help combat infectious disease, and OpGen subsidiary, Ares Gen

Yahoo | August 7, 2023

Read More 'OPGN' Stories Here

OPGN Price Returns

1-mo 28.65%
3-mo -65.35%
6-mo -81.36%
1-year -97.21%
3-year -99.47%
5-year -99.97%
YTD -92.20%
2022 -85.90%
2021 -50.98%
2020 80.53%
2019 -95.65%
2018 -72.19%

Continue Researching OPGN

Want to see what other sources are saying about Opgen Inc's financials and stock price? Try the links below:

Opgen Inc (OPGN) Stock Price | Nasdaq
Opgen Inc (OPGN) Stock Quote, History and News - Yahoo Finance
Opgen Inc (OPGN) Stock Price and Basic Information | MarketWatch

Get Free Updates

Join thousands of investors who get the latest news, insights and top rated picks from StockNews.com!