
Office Properties Income Trust of Beneficial Interest (OPI): Price and Financial Metrics
OPI Price/Volume Stats
| Current price | $2.70 | 52-week high | $8.10 |
| Prev. close | $2.58 | 52-week low | $1.81 |
| Day low | $2.57 | Volume | 329,640 |
| Day high | $2.71 | Avg. volume | 1,163,264 |
| 50-day MA | $2.27 | Dividend yield | 1.48% |
| 200-day MA | $3.51 | Market Cap | 135.76M |
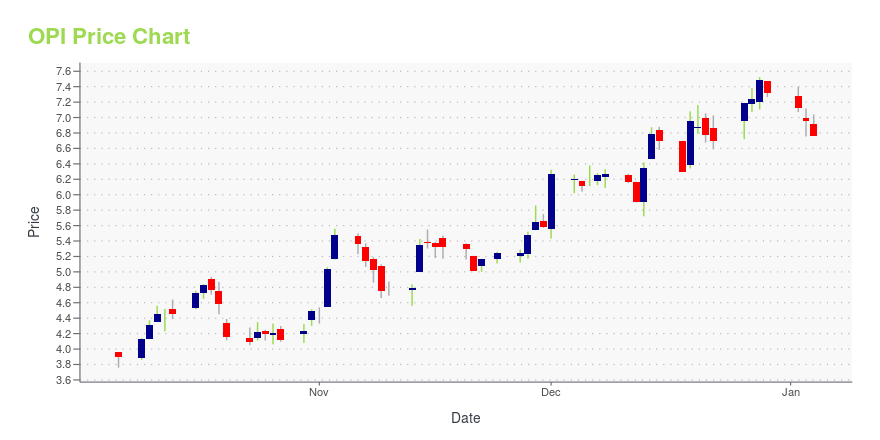
OPI Stock Price Chart Interactive Chart >
Office Properties Income Trust of Beneficial Interest (OPI) Company Bio
Office Properties Income Trust (following merger with Select Income REIT) operates in two business segments: ownership of properties that are primarily leased to Government tenants and its equity method investment in Select Income REIT (SIR). The company was founded in 2009 and is based in Newton, Massachusetts.
Latest OPI News From Around the Web
Below are the latest news stories about OFFICE PROPERTIES INCOME TRUST that investors may wish to consider to help them evaluate OPI as an investment opportunity.
3 Office REITs With Yields Up To 27.35%Office real estate investment trusts (REITs) are companies that own, operate and/or finance income-generating office properties. Just the same as other REITs, they provide an opportunity to invest in real estate without directly buying and subsequently managing the property. Office REITs generate income primarily through leasing office space and collecting rents from tenants. There's no shortage of office REITs to invest in, so it's important to have criteria to guide your decision. For many inv |
3 Lower-Priced REITs With Higher Yields Seeing Renewed BuyingOn Dec. 13, a major change in investor sentiment toward real estate investment trusts (REITs) took place as the Federal Reserve announced another pause in interest rate hikes and suggested there would be three rate cuts in 2024. The REIT sector, which has performed well since early November, took off for several days, before pulling back after Dec. 14. Many low-priced REITs that have been laggards throughout the first 10 months of 2023 are now seeing renewed buying. It seems like investors are b |
Office Properties Income Trust Appoints Yael Duffy as President and Chief Operating Officer Effective January 1, 2024NEWTON, Mass., November 17, 2023--Office Properties Income Trust (Nasdaq: OPI) today announced that Yael Duffy has been appointed President and Chief Operating Officer, effective January 1, 2024. |
The 7 Highest-Yielding Dividend Stocks in NovemberEach of these seven highest-yielding dividend stocks pays annual dividends at or near 20%, but only of them may be worthy of a buy. |
OPI vs. RPT: Which Stock Is the Better Value Option?OPI vs. RPT: Which Stock Is the Better Value Option? |
OPI Price Returns
| 1-mo | 27.96% |
| 3-mo | 34.33% |
| 6-mo | -26.04% |
| 1-year | -61.20% |
| 3-year | -87.48% |
| 5-year | -84.55% |
| YTD | -62.82% |
| 2023 | -35.98% |
| 2022 | -40.04% |
| 2021 | 18.44% |
| 2020 | -23.13% |
| 2019 | 26.09% |
OPI Dividends
| Ex-Dividend Date | Type | Payout Amount | Change | ||||||
|---|---|---|---|---|---|---|---|---|---|
| Loading, please wait... | |||||||||
Continue Researching OPI
Want to see what other sources are saying about Office Properties Income Trust's financials and stock price? Try the links below:Office Properties Income Trust (OPI) Stock Price | Nasdaq
Office Properties Income Trust (OPI) Stock Quote, History and News - Yahoo Finance
Office Properties Income Trust (OPI) Stock Price and Basic Information | MarketWatch
Loading social stream, please wait...