Overseas Shipholding Group, Inc. (OSG): Price and Financial Metrics


Overseas Shipholding Group, Inc. (OSG): $3.71

-0.02 (-0.54%)

POWR Rating

Component Grades

Growth

S

Value

I

Momentum

G

Stability

N

Sentiment

U

Quality

P

Add OSG to Watchlist
Sign Up

Industry: Shipping


Ranked

of

in industry

OSG POWR Grades

  • Momentum is the dimension where OSG ranks best; there it ranks ahead of 99.04% of US stocks.
  • OSG's strongest trending metric is Growth; it's been moving up over the last 179 days.
  • OSG ranks lowest in Stability; there it ranks in the 57th percentile.

OSG Stock Summary

  • Of note is the ratio of OVERSEAS SHIPHOLDING GROUP INC's sales and general administrative expense to its total operating expenses; merely 12.36% of US stocks have a lower such ratio.
  • Over the past twelve months, OSG has reported earnings growth of -289.26%, putting it ahead of only 5.51% of US stocks in our set.
  • Shareholder yield, a measure of how much is returned to shareholders via dividends and share repurchases, for OSG comes in at 18.45% -- higher than that of 90.15% of stocks in our set.
  • Stocks with similar financial metrics, market capitalization, and price volatility to OVERSEAS SHIPHOLDING GROUP INC are RPT, CYXT, WES, EDRY, and MDRR.
  • Visit OSG's SEC page to see the company's official filings. To visit the company's web site, go to www.osg.com.

OSG Valuation Summary

  • In comparison to the median Energy stock, OSG's price/sales ratio is 60% lower, now standing at 0.6.
  • OSG's price/sales ratio has moved down 0.3 over the prior 88 months.

Below are key valuation metrics over time for OSG.

Stock Date P/S P/B P/E EV/EBIT
OSG 2023-03-20 0.6 0.8 10.8 13.0
OSG 2023-03-17 0.6 0.8 10.2 12.8
OSG 2023-03-16 0.6 0.8 10.0 12.7
OSG 2023-03-15 0.6 0.8 10.5 12.9
OSG 2023-03-14 0.6 0.8 10.6 12.9
OSG 2023-03-13 0.6 0.8 10.3 12.8

OSG Growth Metrics

    Its 2 year net income to common stockholders growth rate is now at -200.95%.
  • Its 3 year net cashflow from operations growth rate is now at -102.45%.
  • Its 5 year net income to common stockholders growth rate is now at 109.03%.
OSG's revenue has moved up $70,758,000 over the prior 49 months.

The table below shows OSG's growth in key financial areas (numbers in millions of US dollars).

Date Revenue Operating Cash Flow Net Income to Common Stock
2022-09-30 440.506 49.775 12.803
2022-06-30 411.414 15.906 -16.454
2022-03-31 381.788 -0.866 -30.893
2021-12-31 359.062 -11.832 -46.252
2021-09-30 361.145 -20.03 -43.42
2021-06-30 372.926 -0.167 -28.068

OSG's Quality Factors

The “Quality” component of the POWR Ratings focuses on 31 different factors of a companies fundamentals and operational strength. Here are some key insights as we drill into the specifics of these quality attributes.
  • OSG has a Quality Grade of B, ranking ahead of 82.19% of graded US stocks.
  • OSG's asset turnover comes in at 0.312 -- ranking 65th of 137 Transportation stocks.
  • LPG, RRTS, and WERN are the stocks whose asset turnover ratios are most correlated with OSG.

The table below shows OSG's key quality metrics over time.

Period Asset Turnover Gross Margin ROIC
2021-06-30 0.312 0.207 -0.008
2021-03-31 0.325 0.246 0.004
2020-12-31 0.334 0.300 0.036
2020-09-30 0.338 0.326 0.045
2020-06-30 0.324 0.330 0.043
2020-03-31 0.316 0.328 0.039

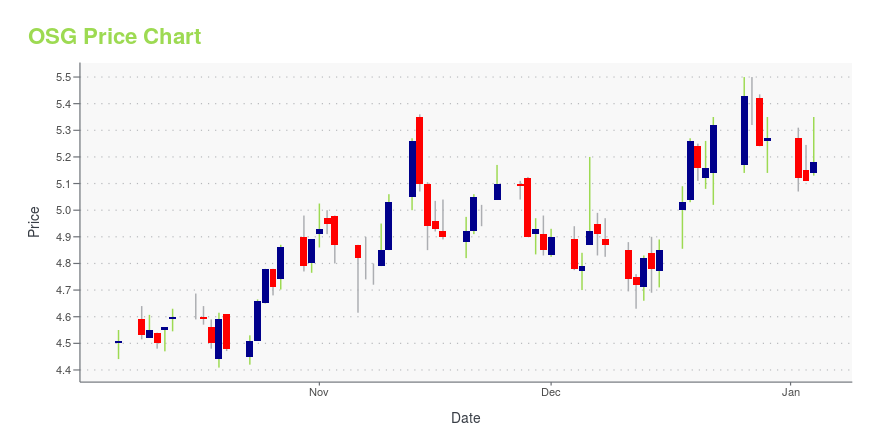
OSG Stock Price Chart Interactive Chart >

Price chart for OSG

OSG Price/Volume Stats

Current price $3.71 52-week high $3.94
Prev. close $3.73 52-week low $1.90
Day low $3.60 Volume 217,800
Day high $3.71 Avg. volume 577,077
50-day MA $3.65 Dividend yield N/A
200-day MA $2.97 Market Cap 291.74M

Overseas Shipholding Group, Inc. (OSG) Company Bio


Overseas Shipholding Group, Inc. primarily engages in the ocean transportation of crude oil and petroleum products. The company was founded in 1948 and is based in Tampa, Florida.


OSG Latest News Stream


Event/Time News Detail
Loading, please wait...

OSG Latest Social Stream


Loading social stream, please wait...

View Full OSG Social Stream

Latest OSG News From Around the Web

Below are the latest news stories about OVERSEAS SHIPHOLDING GROUP INC that investors may wish to consider to help them evaluate OSG as an investment opportunity.

Overseas Shipholding Group Announces Share Repurchase Program

TAMPA, Fla., March 17, 2023--Overseas Shipholding Group Announces Share Repurchase Program

Yahoo | March 17, 2023

Overseas Shipholding Group Reports Fourth Quarter and Full Year 2022 Results

TAMPA, Fla., March 09, 2023--OVERSEAS SHIPHOLDING GROUP REPORTS FOURTH QUARTER AND FULL YEAR 2022 RESULTS

Yahoo | March 9, 2023

Overseas Shipholding Group to Announce Fourth Quarter and Full Year 2022 Results on March 9, 2023

TAMPA, Fla., February 28, 2023--Overseas Shipholding Group to Announce Fourth Quarter and Full year 2022 Results on March 9, 2023

Yahoo | February 28, 2023

Overseas Shipholding Group Announces Charter Option Extensions for Vessels Leased from American Shipping Company

TAMPA, Fla., December 08, 2022--Overseas Shipholding Group Announces Charter Option Extensions for Vessels Leased from American Shipping Company

Yahoo | December 8, 2022

Overseas Shipholding Group Announces Share Repurchase

TAMPA, Fla., November 15, 2022--Overseas Shipholding Group Announces Share Repurchase

Yahoo | November 15, 2022

Read More 'OSG' Stories Here

OSG Price Returns

1-mo -0.80%
3-mo 24.92%
6-mo 24.92%
1-year 74.18%
3-year 77.51%
5-year 44.36%
YTD 28.37%
2022 53.72%
2021 -12.15%
2020 -6.96%
2019 38.55%
2018 -39.42%

Continue Researching OSG

Here are a few links from around the web to help you further your research on Overseas Shipholding Group Inc's stock as an investment opportunity:

Overseas Shipholding Group Inc (OSG) Stock Price | Nasdaq
Overseas Shipholding Group Inc (OSG) Stock Quote, History and News - Yahoo Finance
Overseas Shipholding Group Inc (OSG) Stock Price and Basic Information | MarketWatch

Get Free Updates

Join thousands of investors who get the latest news, insights and top rated picks from StockNews.com!


Page generated in 0.6948 seconds.